Fig. 2
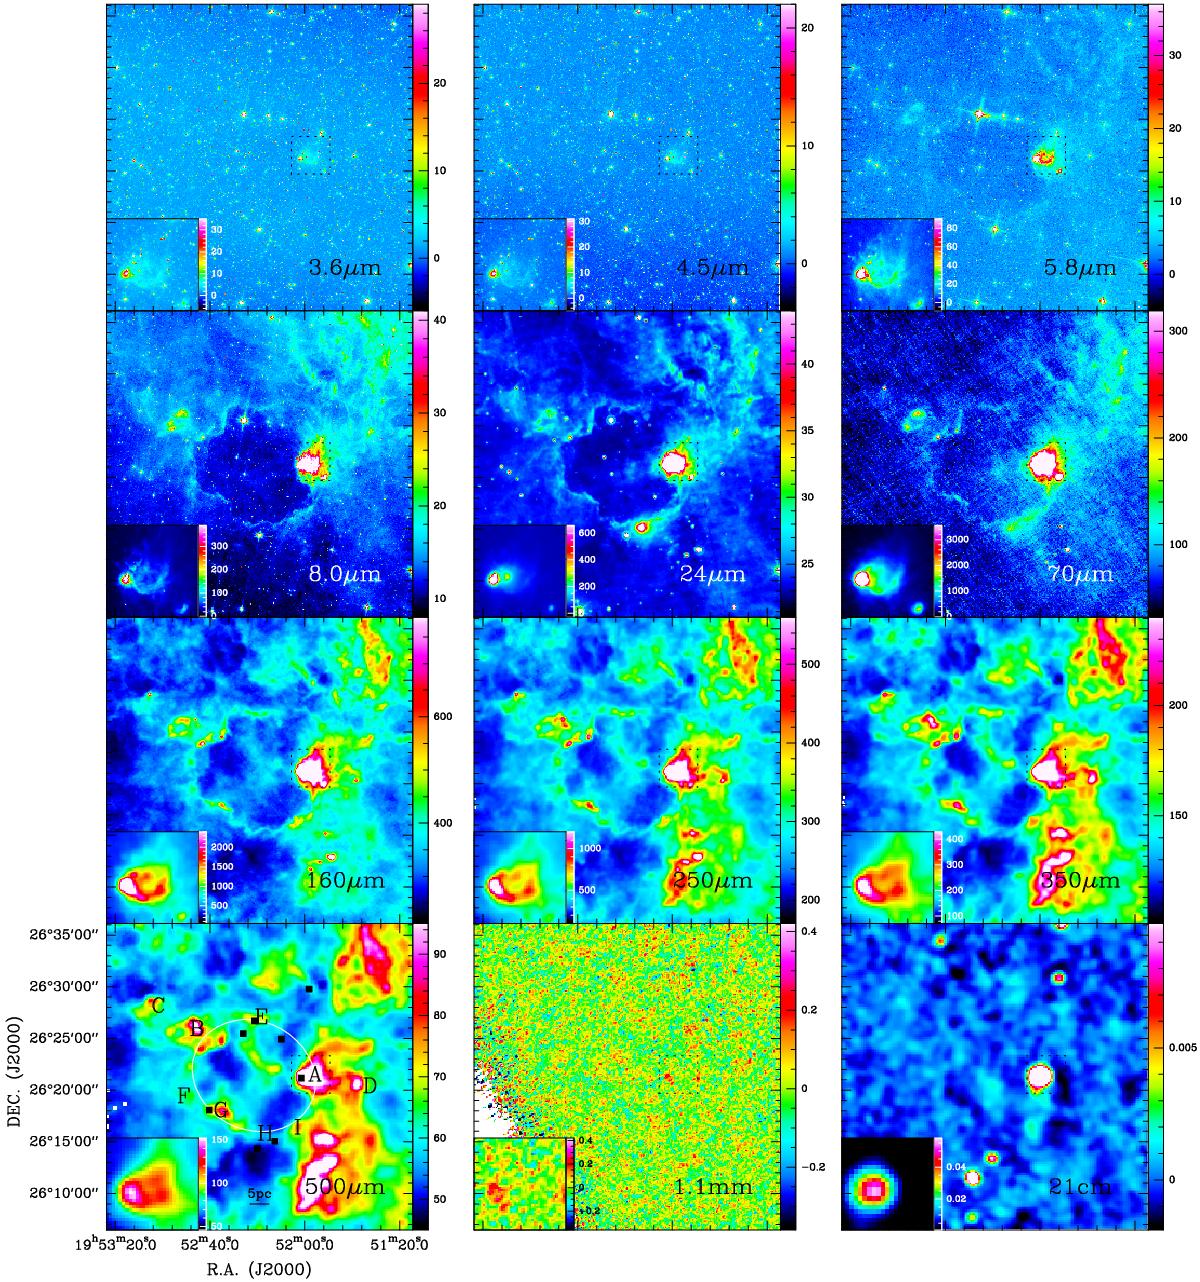
Multiwavelength images of the bubble N131 from 3.6 μm to 21 cm. The saturated region within the dashed square is shown in the bottom-left corner of each subfigure, as a zoom in with adjusted intensity scale. The unit of each colour bar is, respectively, MJy sr-1 for 3.6, 4.5, 5.8, 8.0, 24, 70, 160, 250, 350, 500 μm, Jy beam-1 for 1.1 mm, and 21 cm. In the 500 μm subfigure, the symbols “■”, letters (A, B, ..., and I), and ellipse indicate the positions of eight IRAS point sources, nine molecular clumps, and the ring-like shell of the bubble, respectively.
Current usage metrics show cumulative count of Article Views (full-text article views including HTML views, PDF and ePub downloads, according to the available data) and Abstracts Views on Vision4Press platform.
Data correspond to usage on the plateform after 2015. The current usage metrics is available 48-96 hours after online publication and is updated daily on week days.
Initial download of the metrics may take a while.