Fig. 10
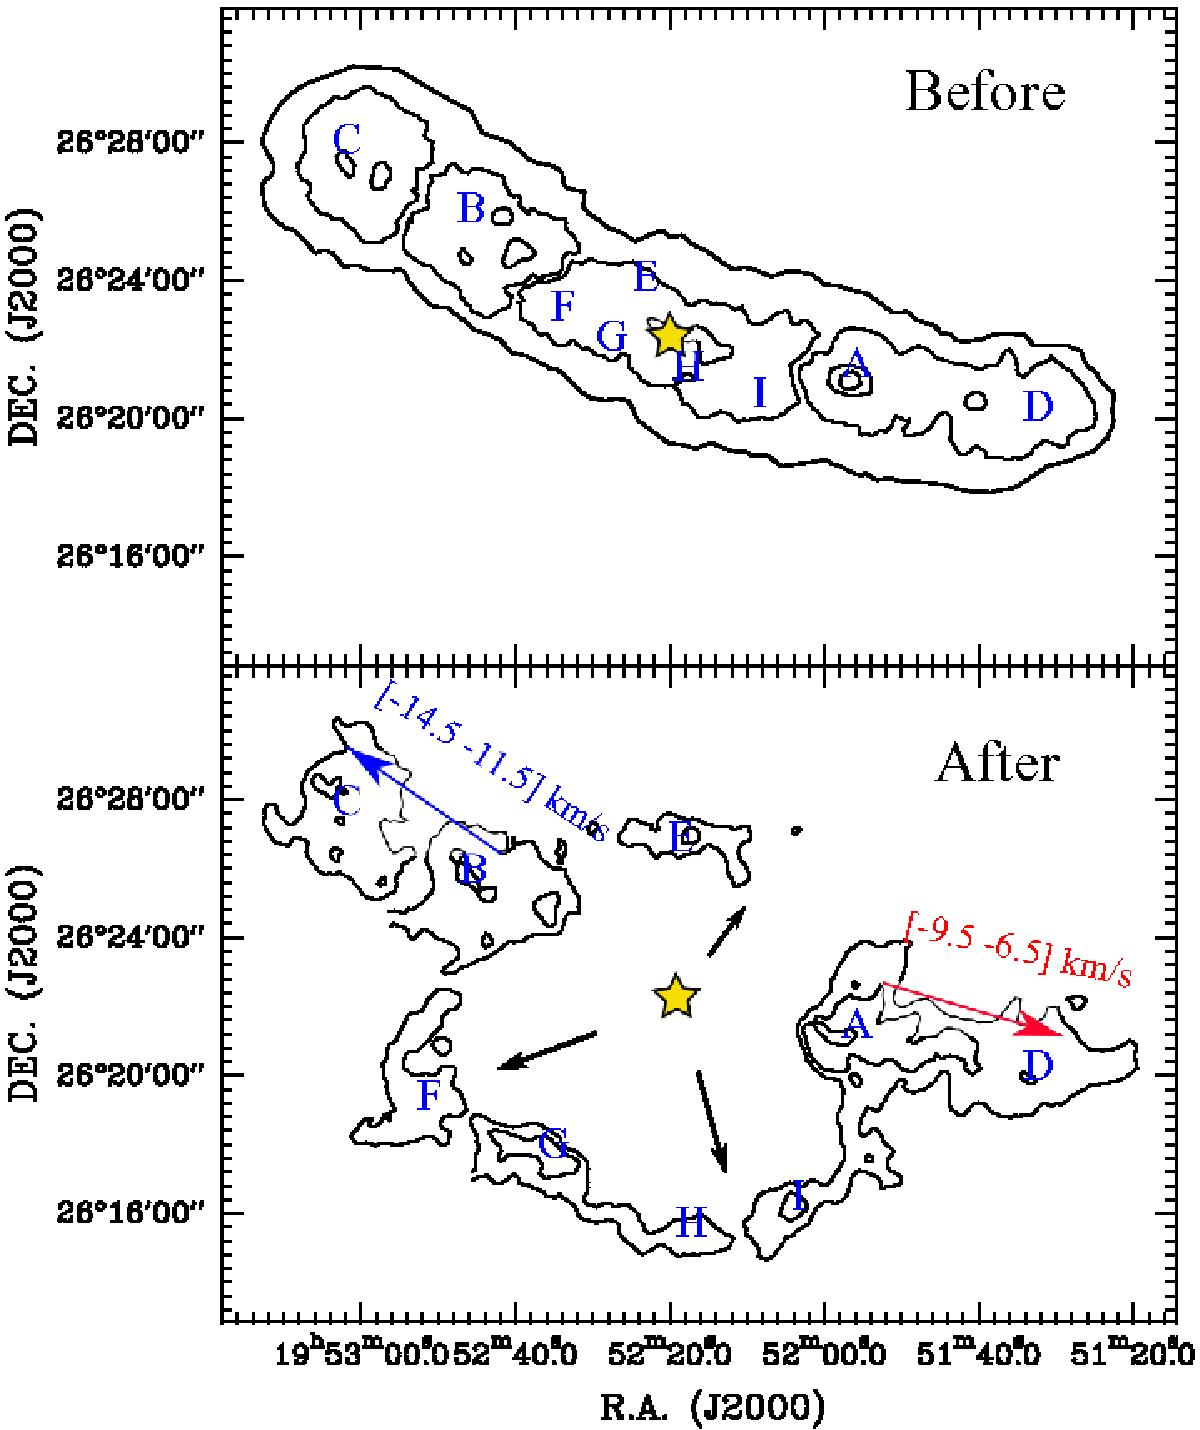
A schematic illustration depicting our target region before and after the formation of bubble N131. The yellow star indicates a group of ionizing stars that caused the expansion of the shell. In the upper panel, we indicate the proposed pre-existing clumps A to I. In the lower panel, we indicate the observed clumps A to I and the velocity structure.
Current usage metrics show cumulative count of Article Views (full-text article views including HTML views, PDF and ePub downloads, according to the available data) and Abstracts Views on Vision4Press platform.
Data correspond to usage on the plateform after 2015. The current usage metrics is available 48-96 hours after online publication and is updated daily on week days.
Initial download of the metrics may take a while.