Fig. 1
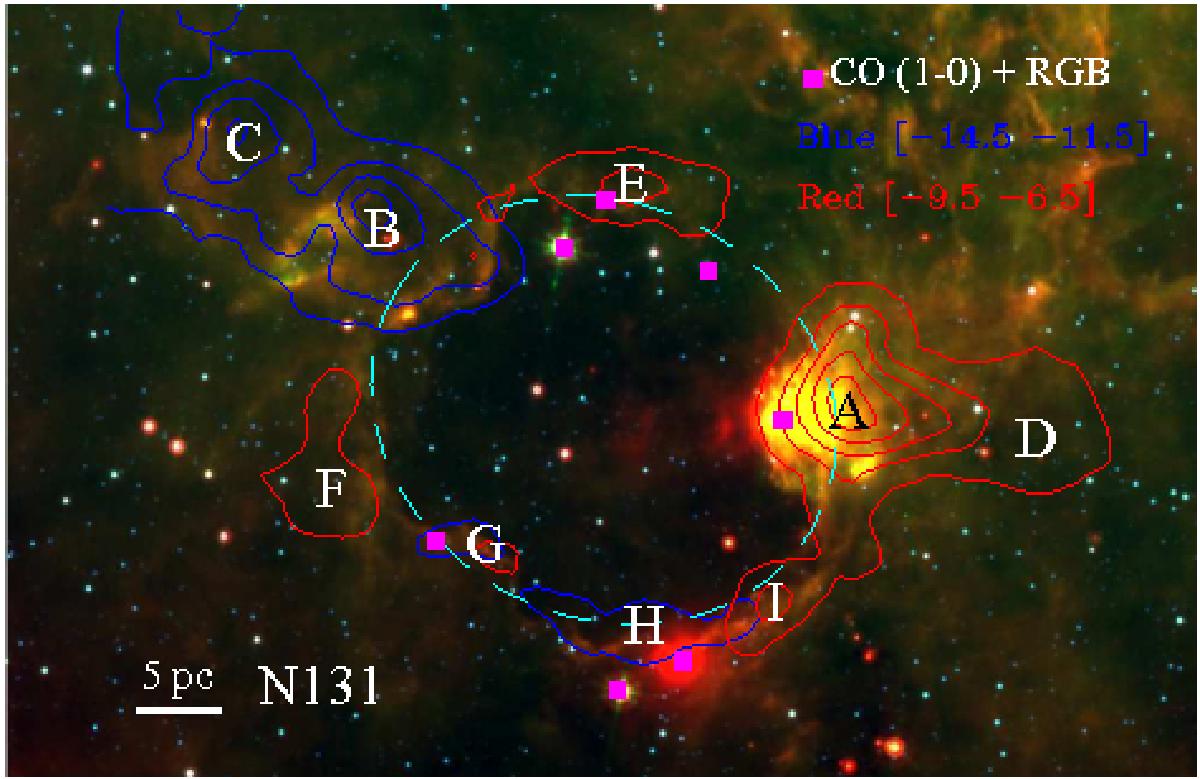
Integrated intensity contours of the CO (1–0) line of the blueshifted and redshifted clouds superimposed on the RGB image with 24 μm (red), 8.0 μm (green), and 4.5 μm (blue). The CO (1–0) data is from Zhang et al. (2013). The integration range is from −14.5 to −11.5km s-1 for the blueshifted cloud, and from −9.5 to −6.5km s-1 for the redshifted cloud. The symbols “■”, letters (A, B, ..., and I), and ellipse indicate the positions of eight IRAS point sources, nine molecular clumps, and ring-like shell of the bubble, respectively.
Current usage metrics show cumulative count of Article Views (full-text article views including HTML views, PDF and ePub downloads, according to the available data) and Abstracts Views on Vision4Press platform.
Data correspond to usage on the plateform after 2015. The current usage metrics is available 48-96 hours after online publication and is updated daily on week days.
Initial download of the metrics may take a while.