Free Access
Fig. 7
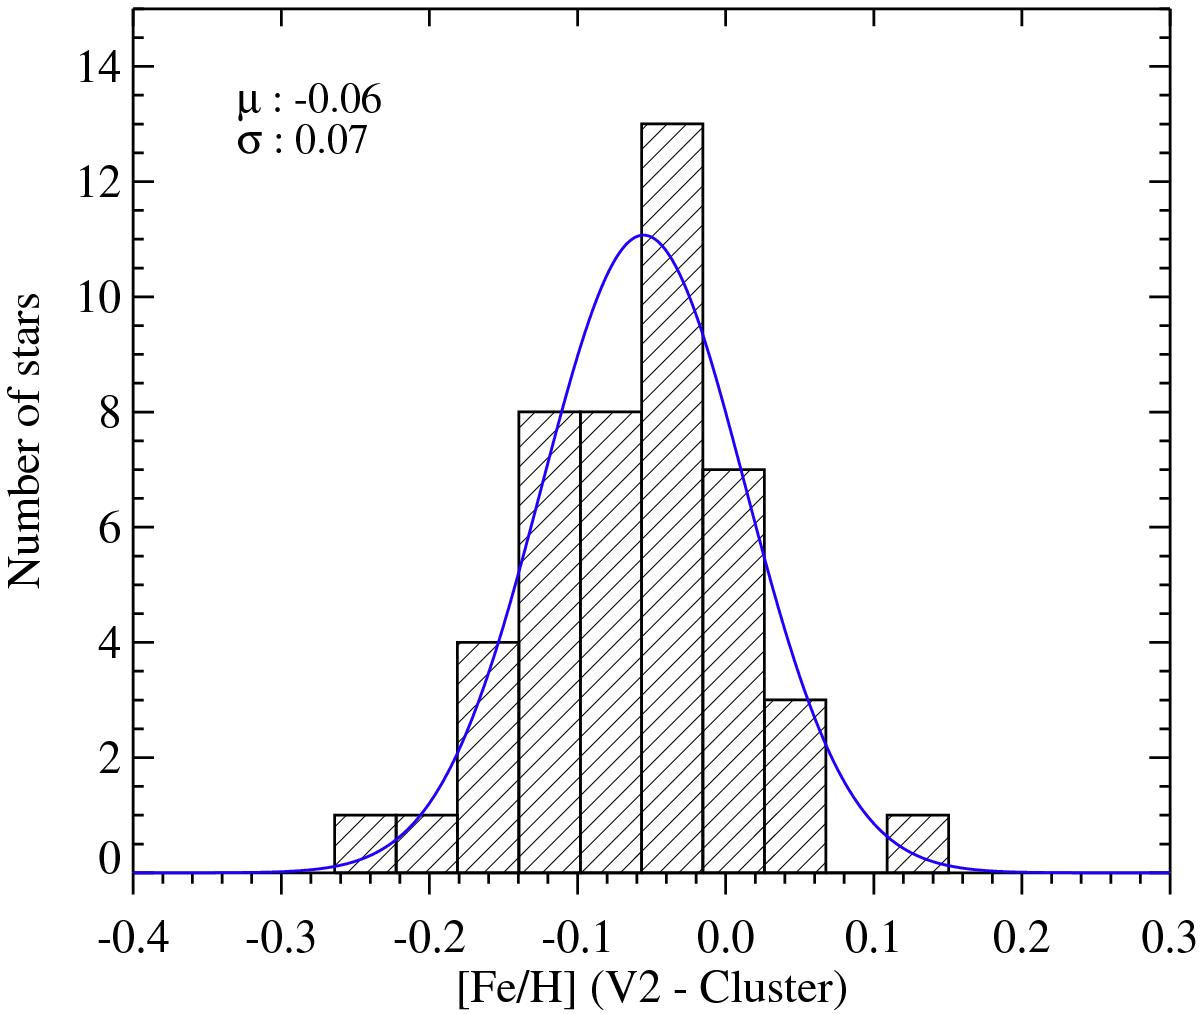
Histogram of metallicity residuals for the cluster stars. The X-axis is the difference between the measured and compiled [Fe/H], and Y-axis shows the number of stars. The blue line is the Gaussian with the same mean and standard deviation as the distribution.
Current usage metrics show cumulative count of Article Views (full-text article views including HTML views, PDF and ePub downloads, according to the available data) and Abstracts Views on Vision4Press platform.
Data correspond to usage on the plateform after 2015. The current usage metrics is available 48-96 hours after online publication and is updated daily on week days.
Initial download of the metrics may take a while.