Fig. 5
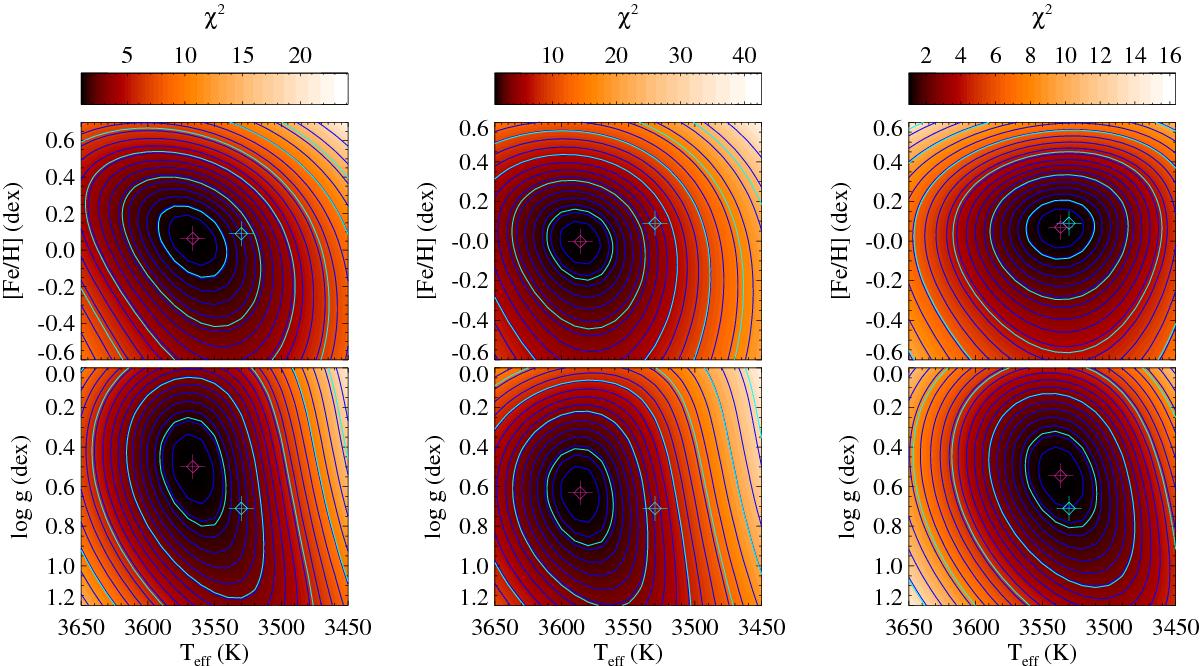
χ2 maps for HD 61913 with different fitting wavelength ranges. First with the complete wavelength range used (3600−7400 Å), second 3600−5500 Å, and third 5500−7200 Å. The red crosses indicate the χ2 minimum, and the cyan crosses the compiled parameters. The inner contour in cyan correspond to the external errors, and the other contours correspond to the 2, 3, 4 ... σ levels.
Current usage metrics show cumulative count of Article Views (full-text article views including HTML views, PDF and ePub downloads, according to the available data) and Abstracts Views on Vision4Press platform.
Data correspond to usage on the plateform after 2015. The current usage metrics is available 48-96 hours after online publication and is updated daily on week days.
Initial download of the metrics may take a while.