Fig. 3
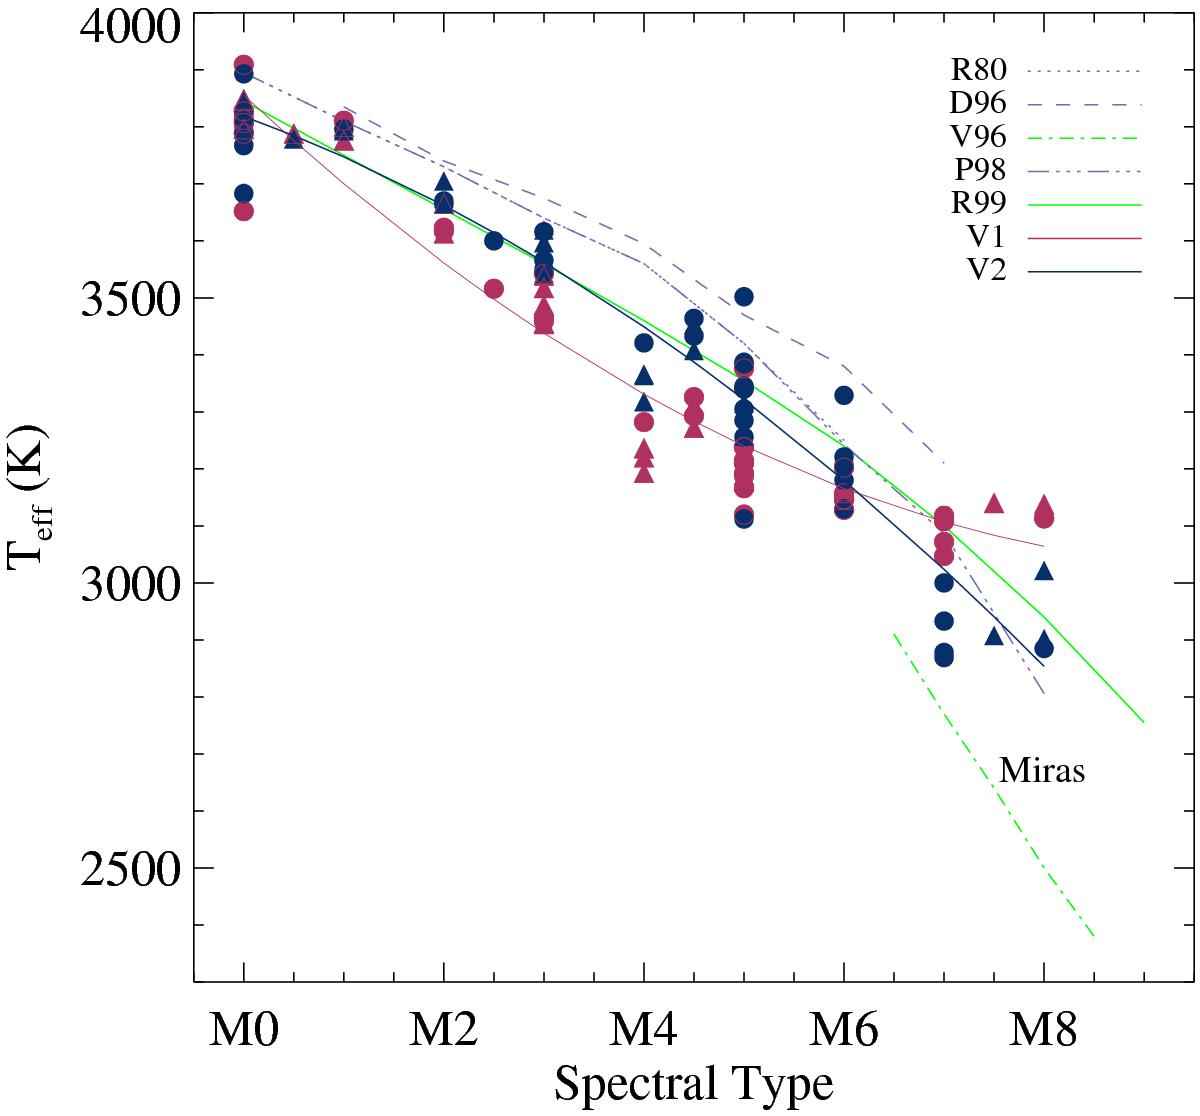
Teff vs. spectral type diagram for the M giants. The purple lines are the relations derived by Ridgway et al. (1980, R80), Dyck et al. (1996, D96), Perrin et al. (1998, P98). The green lines are the relations derived by Richichi et al. (1999, R99) and van Belle et al. (1996, V96) as indicated in the legend. The triangles represent the MILES spectra and the circles the ELODIE spectra. V1 solutions are shown in maroon and V2 solutions in dark blue. The maroon and dark blue lines are the quadratic fits to the V1 and V2 solutions, respectively.
Current usage metrics show cumulative count of Article Views (full-text article views including HTML views, PDF and ePub downloads, according to the available data) and Abstracts Views on Vision4Press platform.
Data correspond to usage on the plateform after 2015. The current usage metrics is available 48-96 hours after online publication and is updated daily on week days.
Initial download of the metrics may take a while.