Fig. A.3
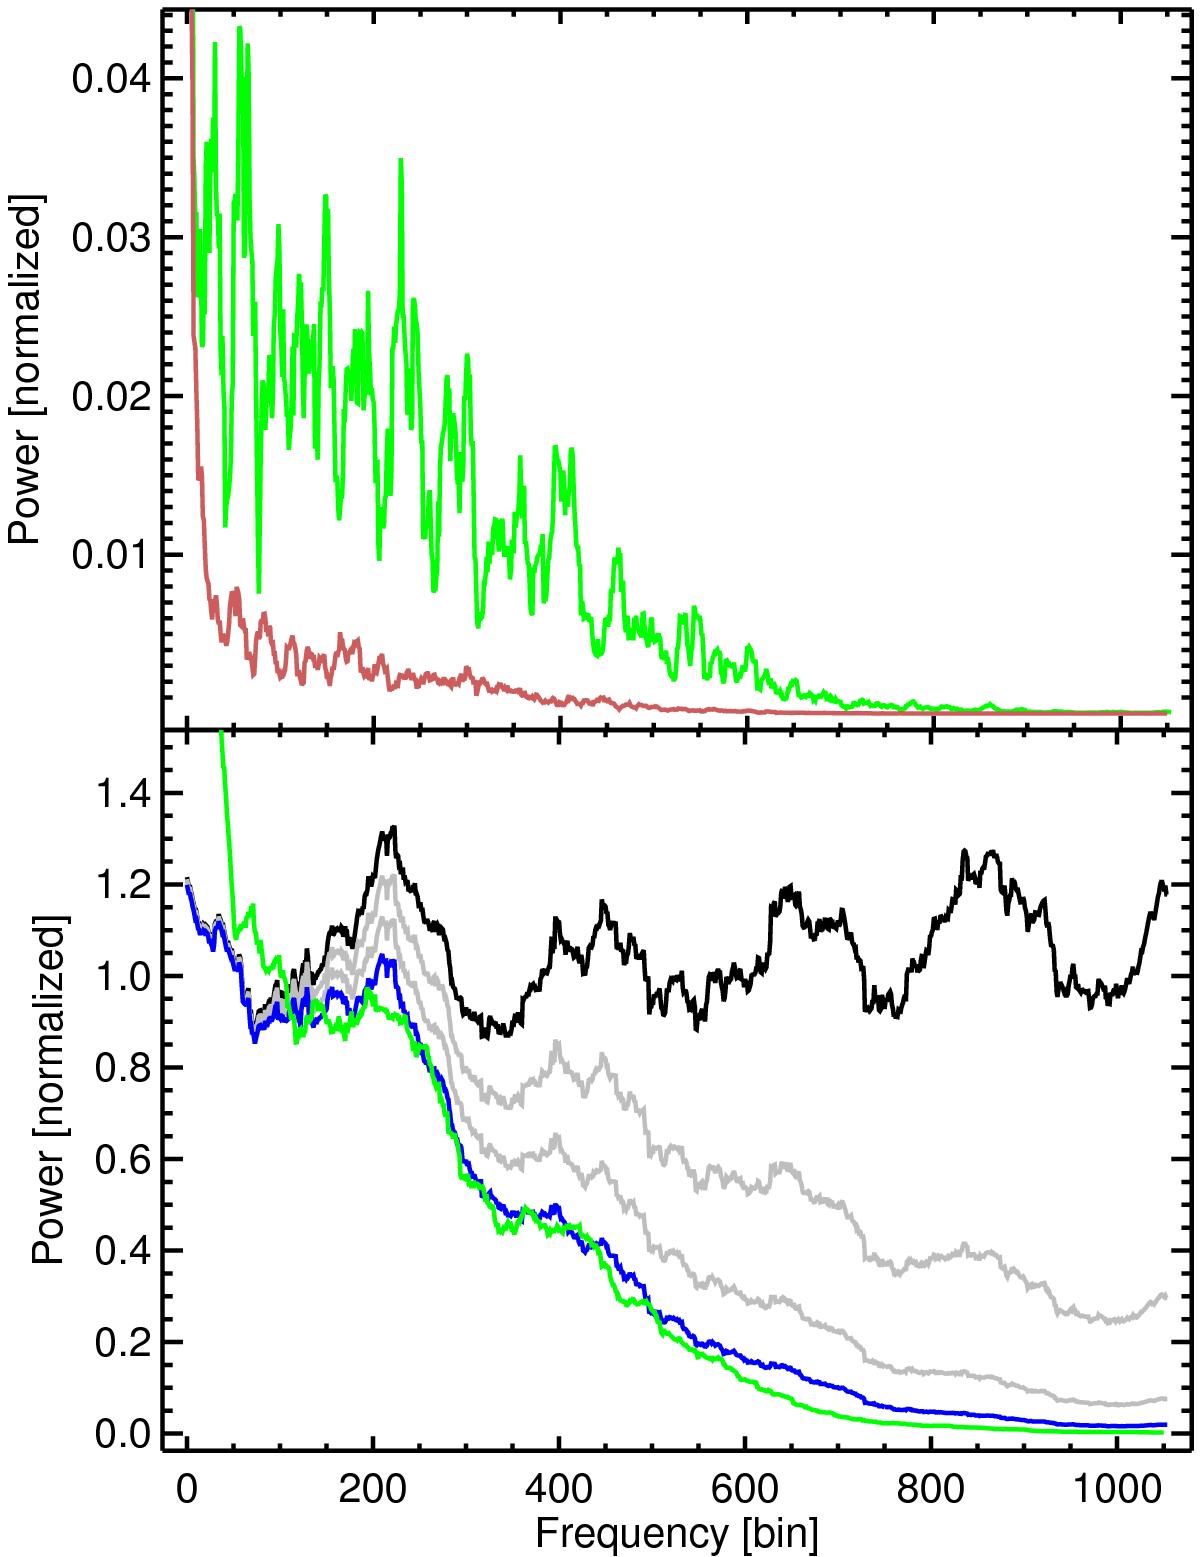
Effect of rebinning on the power spectrum. a) The top panel shows the power spectra of MILES 915 (a noisy spectrum, in green) and MILES 924 (a high S/N spectrum, red); the power spectra are smoothed with a 10 bin boxcar for visualization purposes. b) The bottom panel represents the power spectrum of white noise (in black), and of its transformation after one, two (in grey) and three (in blue) quarter-pixel shift linear rebinnings. The green line is the difference between the two spectra of the top panel. The power spectra are smoothed with a 100 bin boxcar for visualization purposes.
Current usage metrics show cumulative count of Article Views (full-text article views including HTML views, PDF and ePub downloads, according to the available data) and Abstracts Views on Vision4Press platform.
Data correspond to usage on the plateform after 2015. The current usage metrics is available 48-96 hours after online publication and is updated daily on week days.
Initial download of the metrics may take a while.