Fig. 1
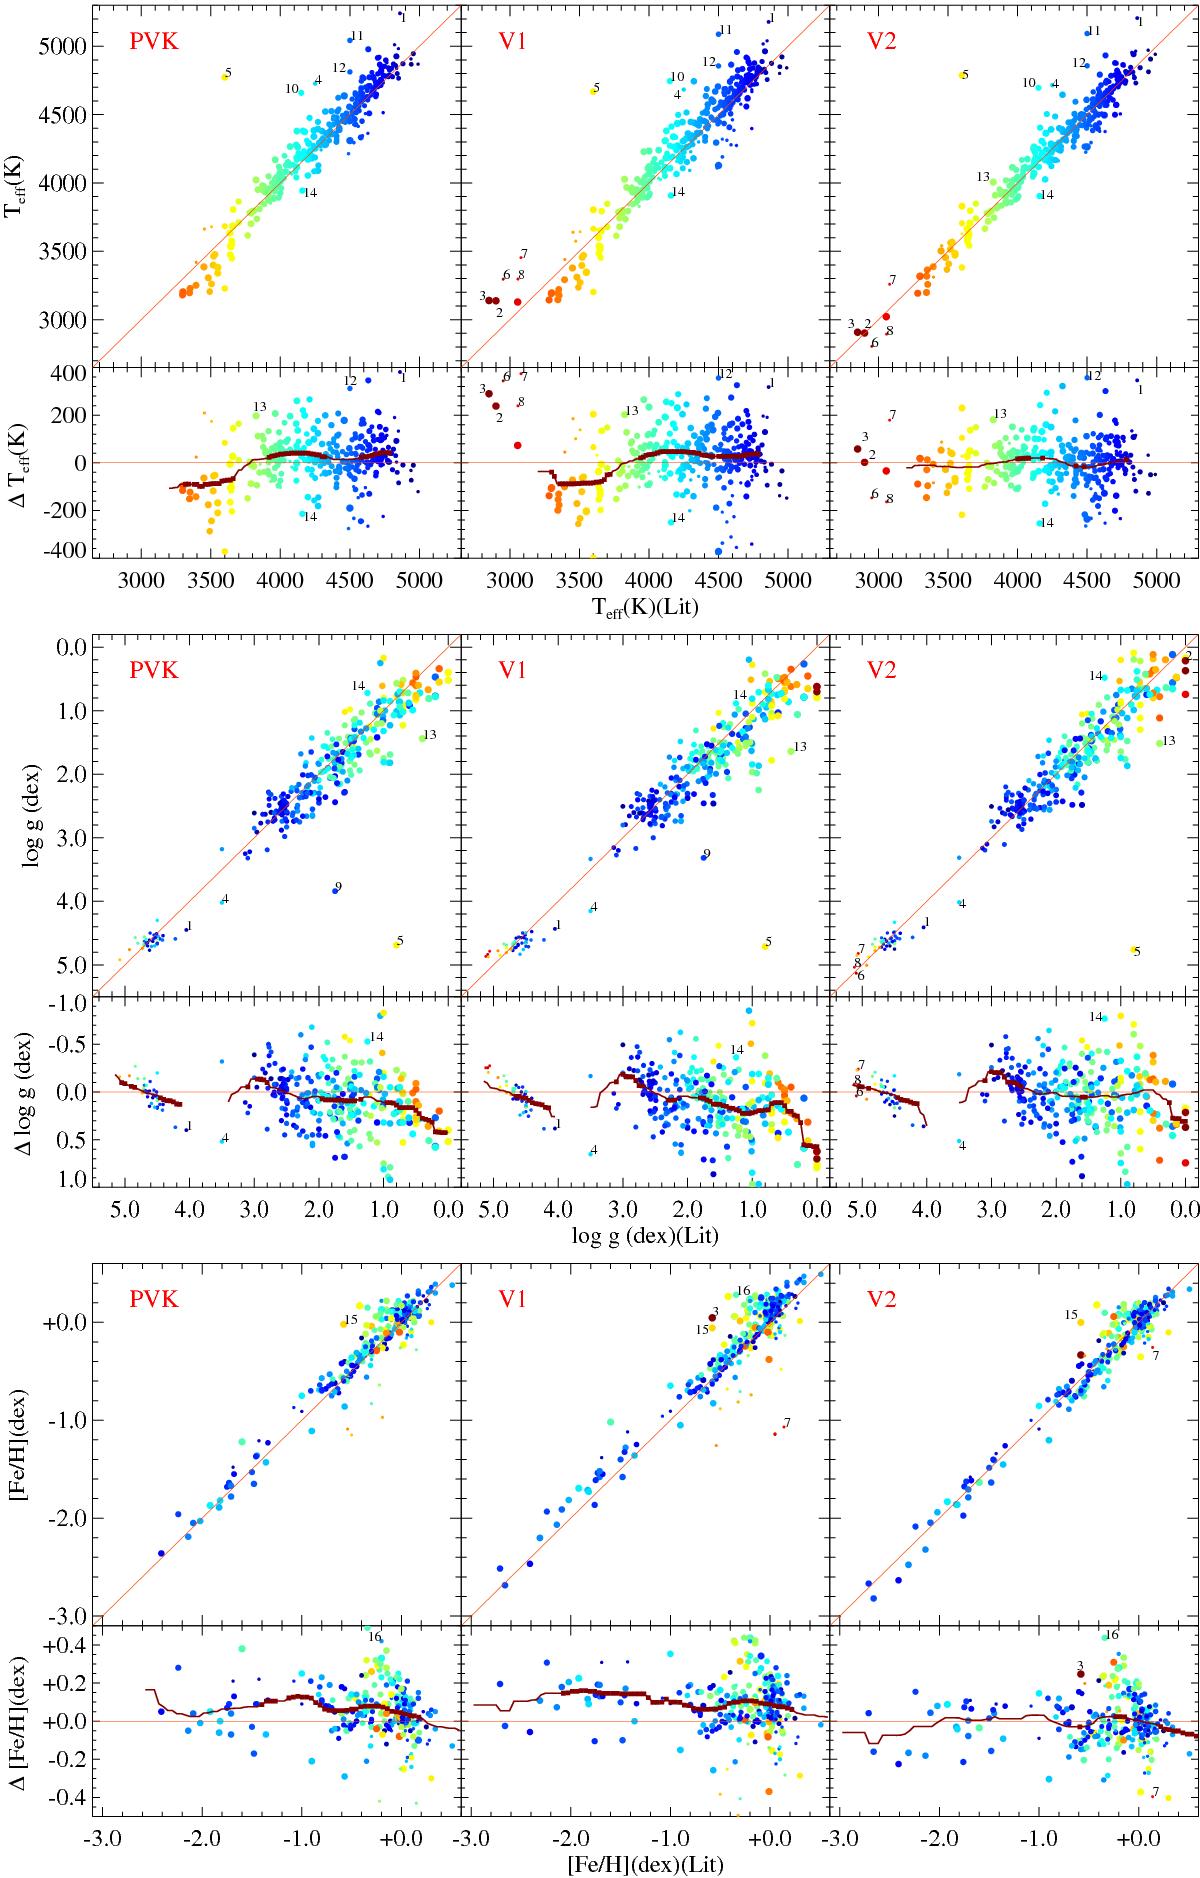
Comparison of the atmospheric parameters adopted in PVK and estimated using V1 and V2 versions of the interpolator with those of the literature compilation. The abscissae are the values from the compilation, and the ordinates of the top plot of each panel are those from PVK, V1, or V2. The residuals presented in the bottom plot of each panel are the PVK, V1, or V2 values minus those of the compilation. The red lines show the biases, the bold sections indicating regions where they are statistically significant. The stars labelled with numbers are discussed in Sect. 5.4. The colour of the symbols represents the temperature and the size is linked to the surface gravity.
Current usage metrics show cumulative count of Article Views (full-text article views including HTML views, PDF and ePub downloads, according to the available data) and Abstracts Views on Vision4Press platform.
Data correspond to usage on the plateform after 2015. The current usage metrics is available 48-96 hours after online publication and is updated daily on week days.
Initial download of the metrics may take a while.