Fig. 8
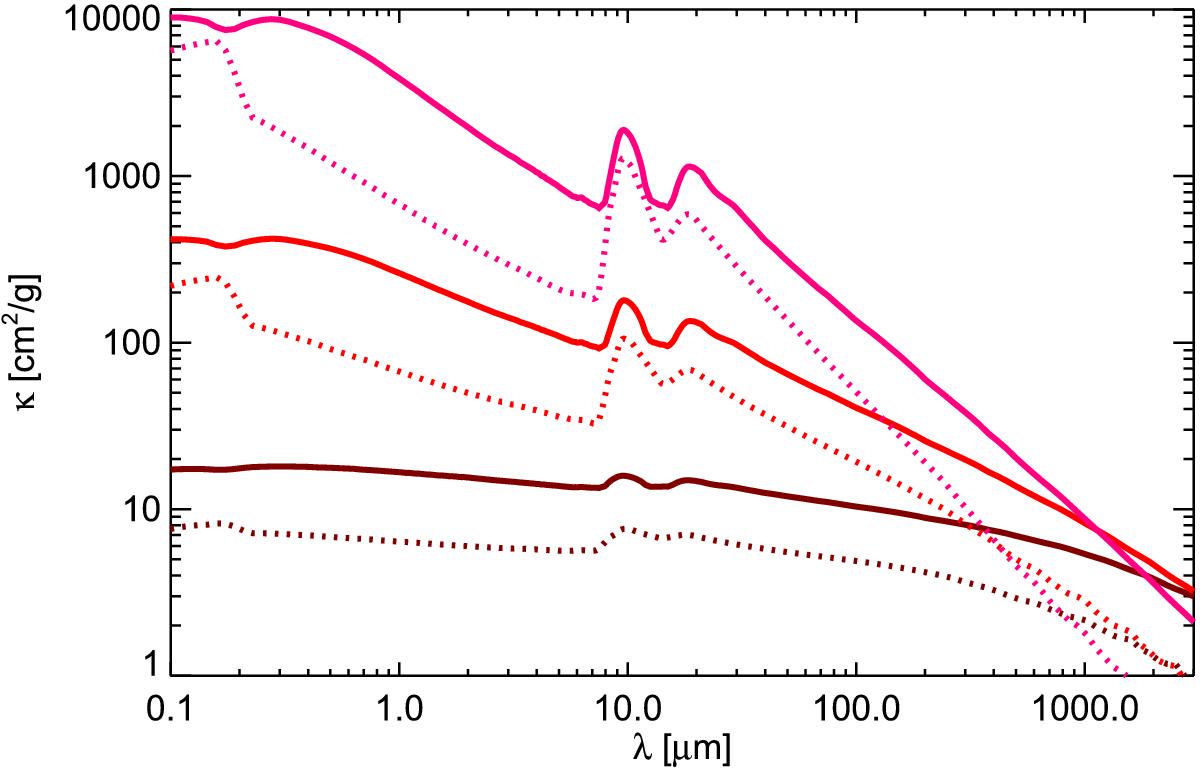
Size-distribution-averaged mass absorption cross section computed with the DHS method with the effective medium theory (solid lines) compared to those computed for spherical particles composed of astronomical silicate (dotted lines). The different colors correspond to different slopes (i.e., values of p) of the size distribution: p = 4 (pink), p = 3.5 (red), and p = 3 (brown).
Current usage metrics show cumulative count of Article Views (full-text article views including HTML views, PDF and ePub downloads, according to the available data) and Abstracts Views on Vision4Press platform.
Data correspond to usage on the plateform after 2015. The current usage metrics is available 48-96 hours after online publication and is updated daily on week days.
Initial download of the metrics may take a while.