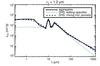
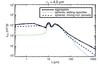
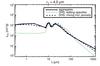
Fig. 3
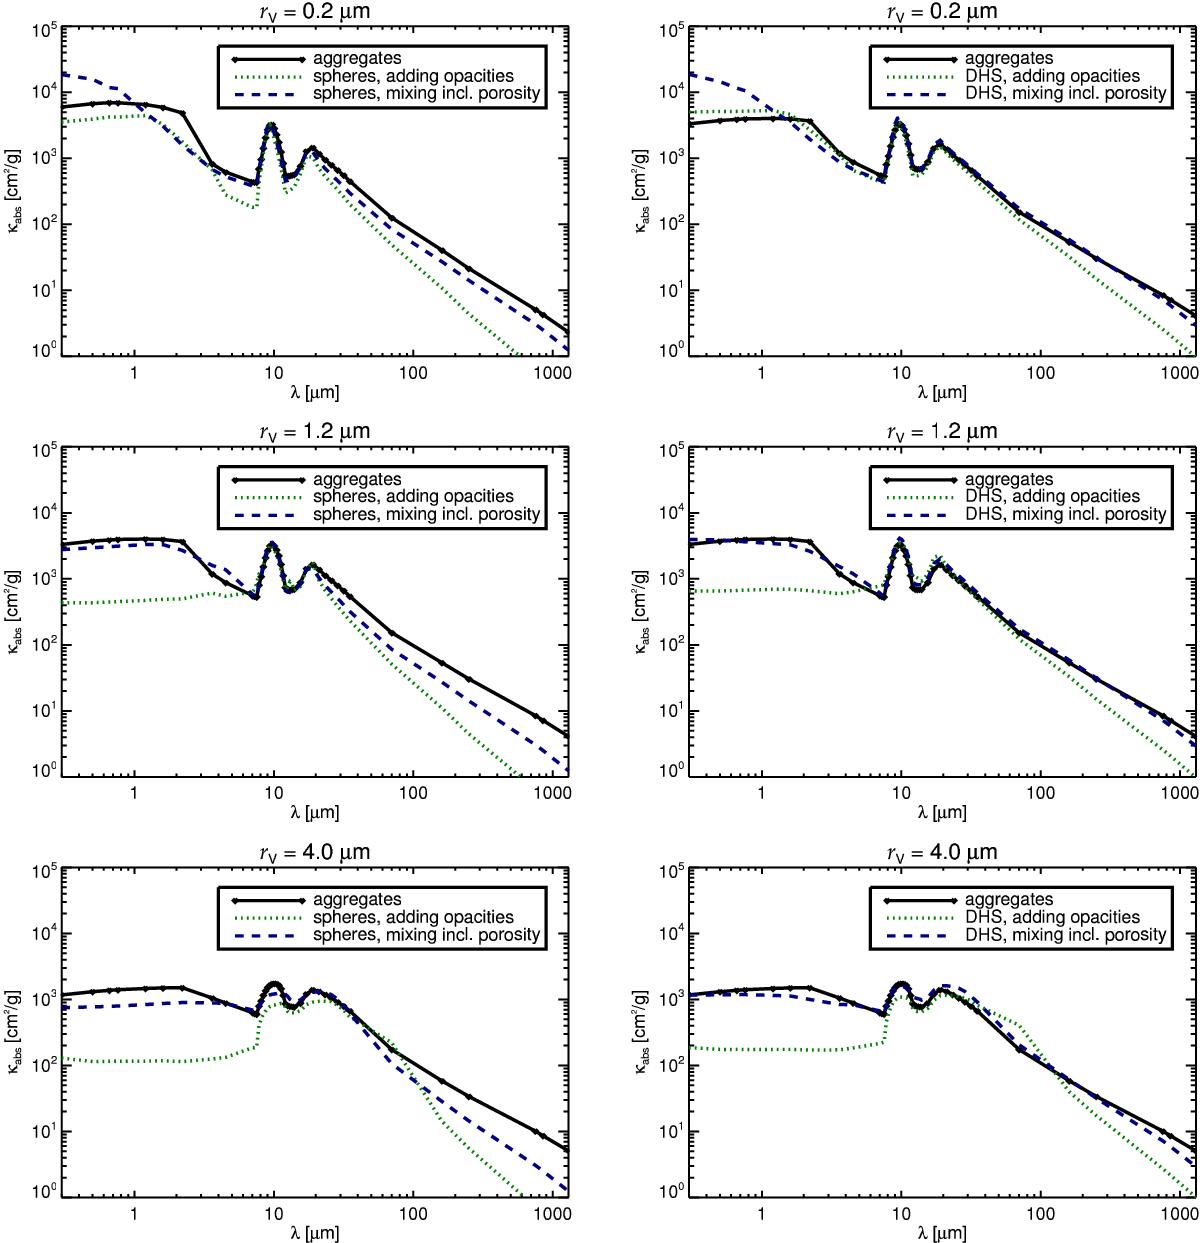
Absorption cross section of the aggregate particles as a function of wavelength for three different particle sizes compared to the approximate methods. The upper panels show the aggregates for a volume-equivalent radius of 0.2 μm, the middle panels show 1.2 μm, and the lower panels4.0 μm particles. The left panels show spherical particles with and without added porosity, the right panels show the opacities computed with the DHS method with and without porosity.
Current usage metrics show cumulative count of Article Views (full-text article views including HTML views, PDF and ePub downloads, according to the available data) and Abstracts Views on Vision4Press platform.
Data correspond to usage on the plateform after 2015. The current usage metrics is available 48-96 hours after online publication and is updated daily on week days.
Initial download of the metrics may take a while.