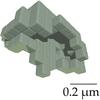
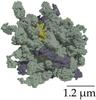
Fig. 1
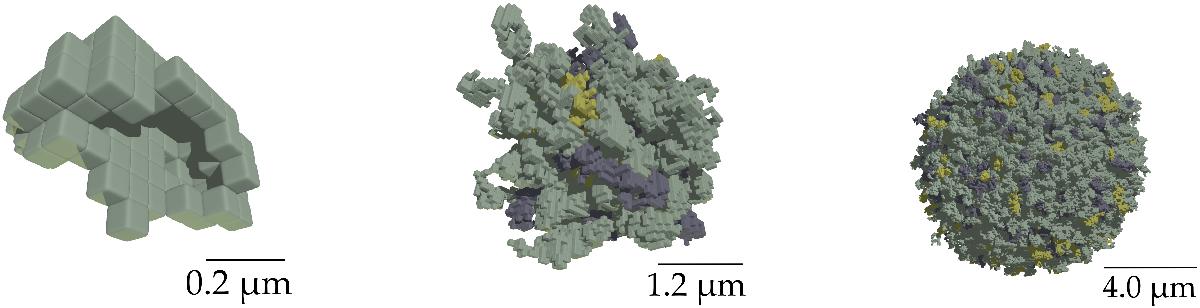
Images of the particles used in the DDA computations. The left image shows a single monomer, containing approximately 100 dipoles, the middle image is an aggregate containing 216 of these monomers, and at the far right we show the largest aggregate we consider, containing 8000 monomers. The horizontal line indicates the scale in each image.
Current usage metrics show cumulative count of Article Views (full-text article views including HTML views, PDF and ePub downloads, according to the available data) and Abstracts Views on Vision4Press platform.
Data correspond to usage on the plateform after 2015. The current usage metrics is available 48-96 hours after online publication and is updated daily on week days.
Initial download of the metrics may take a while.