Fig. 6
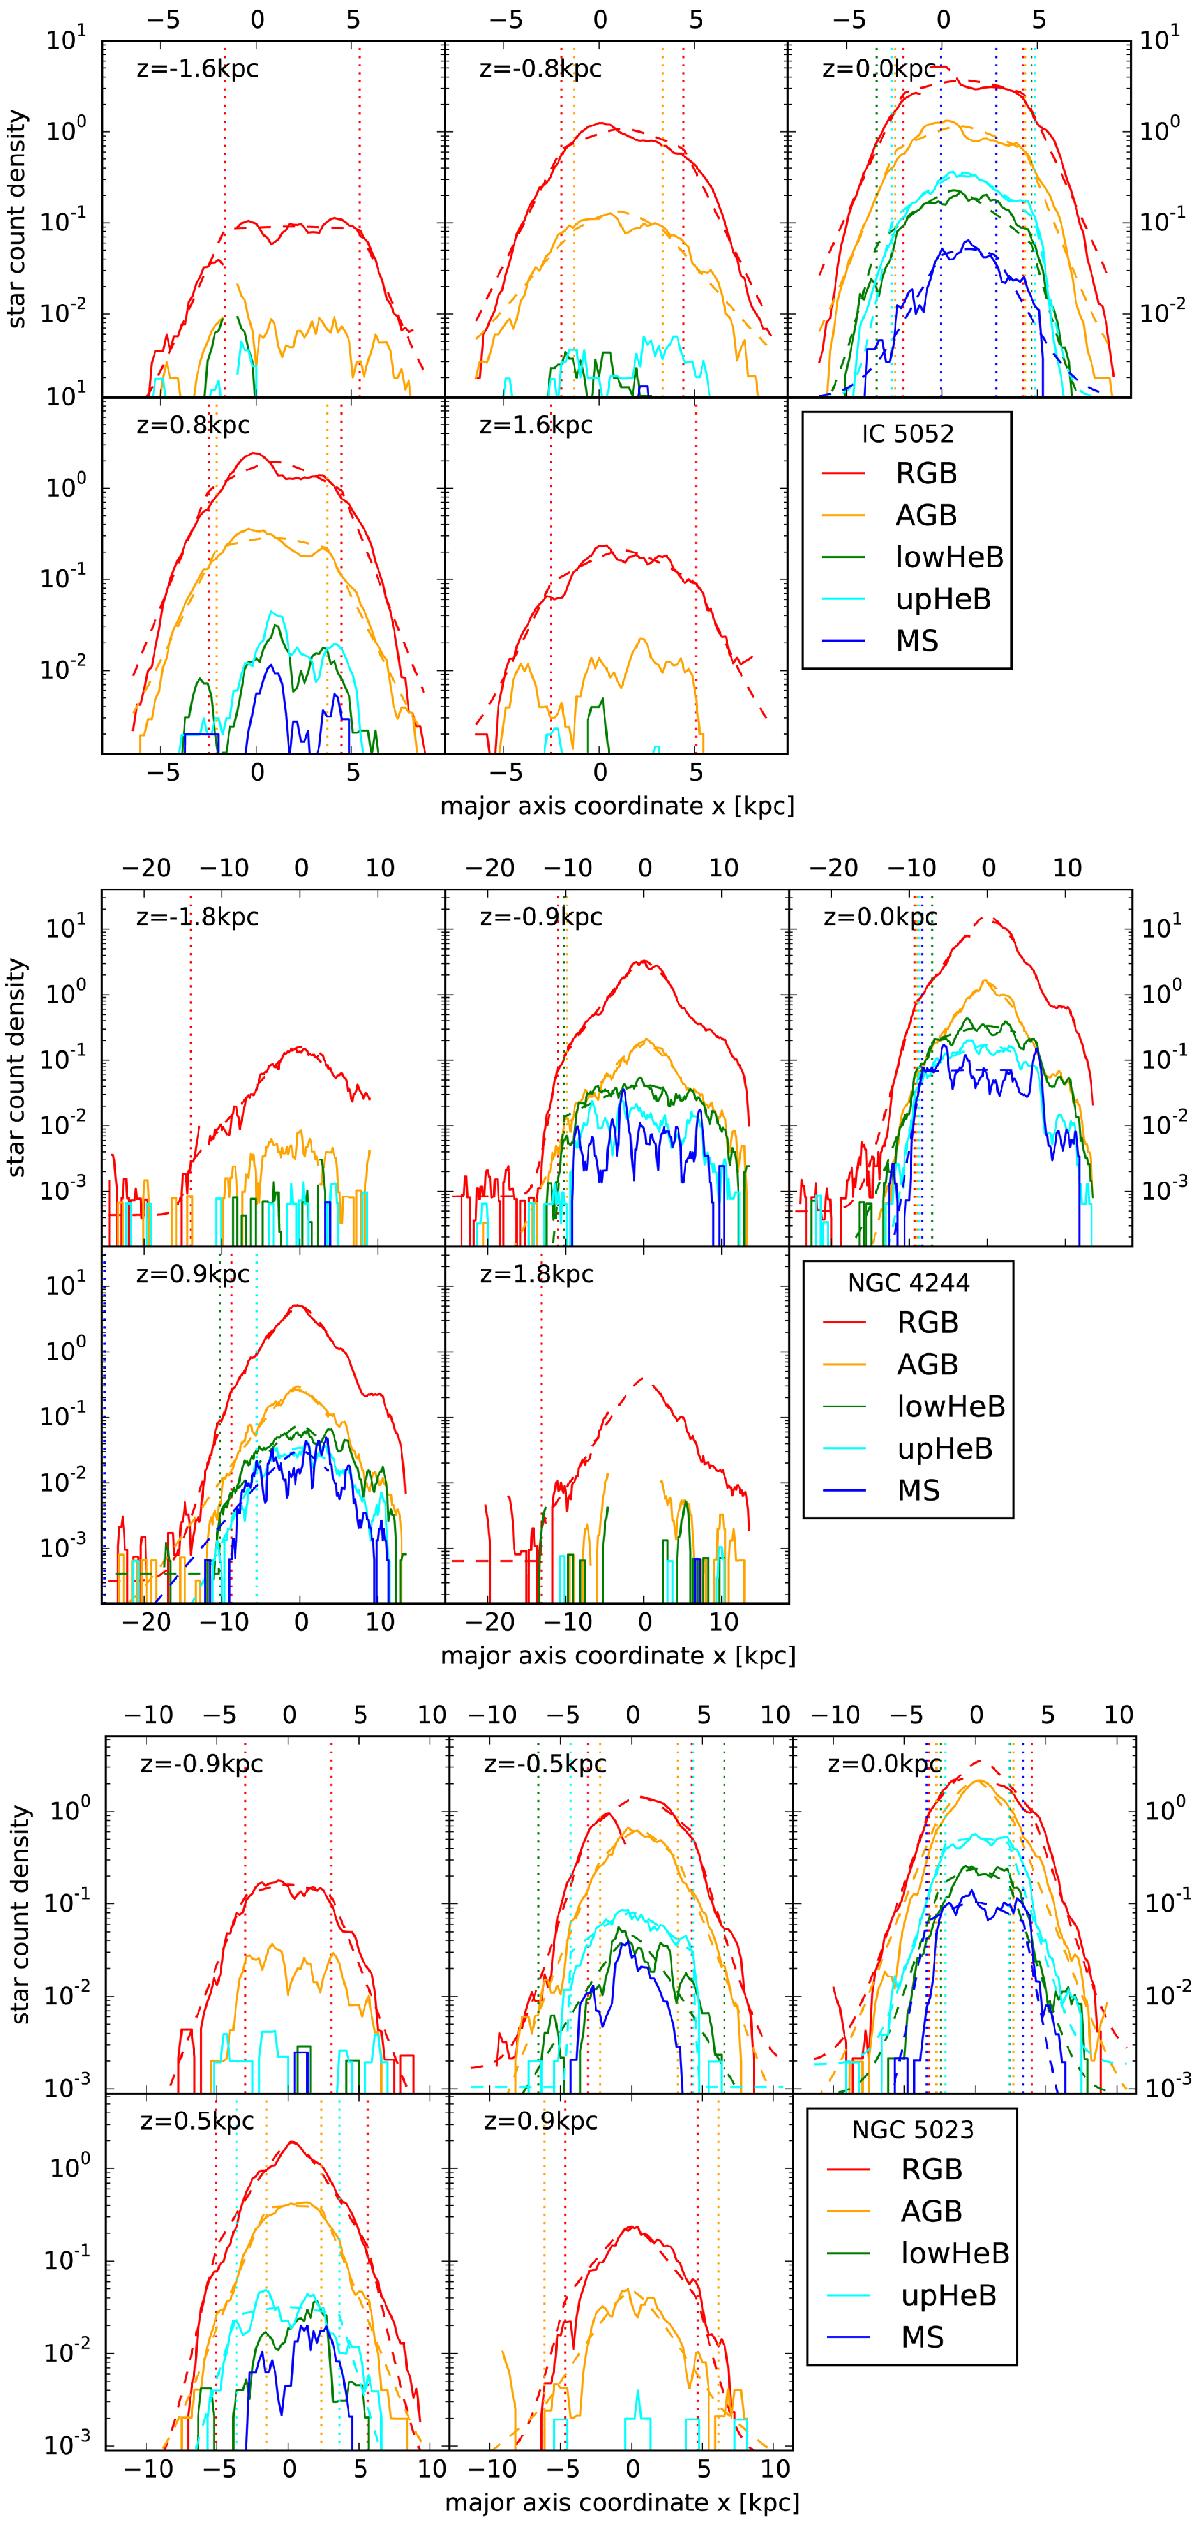
Radial density profiles of the five populations (red – RGB; yellow – AGB, green – lower HeB; cyan – upper HeB; blue – MS) at different heights above the plane in three low-mass edge-on galaxies: IC 5052, NGC 4244, and NGC 5023 (top to bottom). Solid lines are the data, dashed lines are the best fits. Vertical dotted lines show the break radii of the fits. The boundaries of the regions from which the profiles are extracted are shown in Fig. 2 as horizontal gray lines.
Current usage metrics show cumulative count of Article Views (full-text article views including HTML views, PDF and ePub downloads, according to the available data) and Abstracts Views on Vision4Press platform.
Data correspond to usage on the plateform after 2015. The current usage metrics is available 48-96 hours after online publication and is updated daily on week days.
Initial download of the metrics may take a while.