Fig. C.1
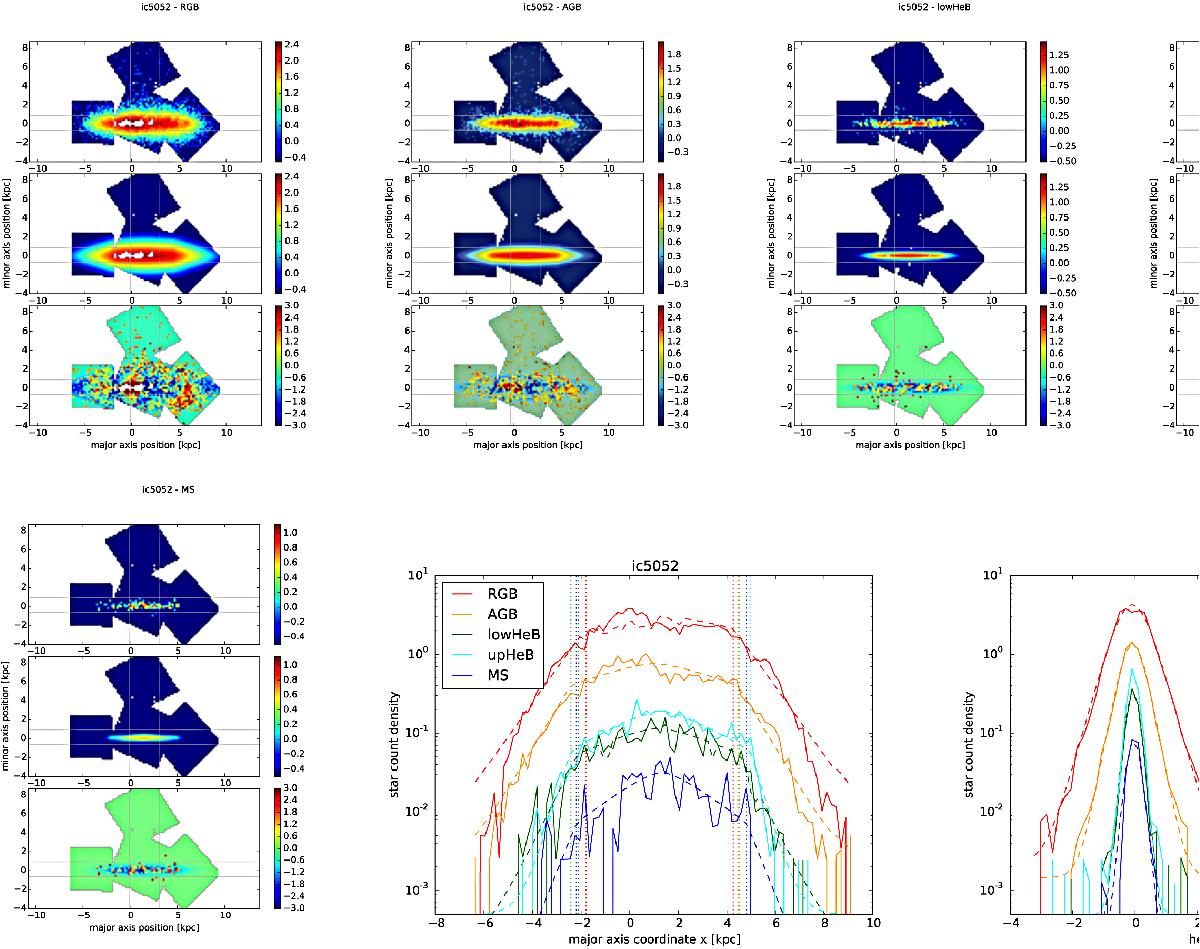
Top row: 2D fit maps of the five populations in IC 5052 (from left to right: RGB, AGB, lowHeB, upHeB, MS). Each panel contains three maps: top: stellar density maps, middle: best-fit model, bottom: weighted residual (data−model, see Eq. (C.1)). The gray lines show the regions from which the minor and major axis profiles are extracted. The two overdensities in the residual map of the fit to the RGB data (left panel). Bottom row (middle and right): major and minor axis profiles of the data (solid lines) and the 2D models (dashed lines); dotted vertical lines show the break radii. The model lines may show irregularities (as the real data do) due to masked-out regions.
Current usage metrics show cumulative count of Article Views (full-text article views including HTML views, PDF and ePub downloads, according to the available data) and Abstracts Views on Vision4Press platform.
Data correspond to usage on the plateform after 2015. The current usage metrics is available 48-96 hours after online publication and is updated daily on week days.
Initial download of the metrics may take a while.