Fig. B.1
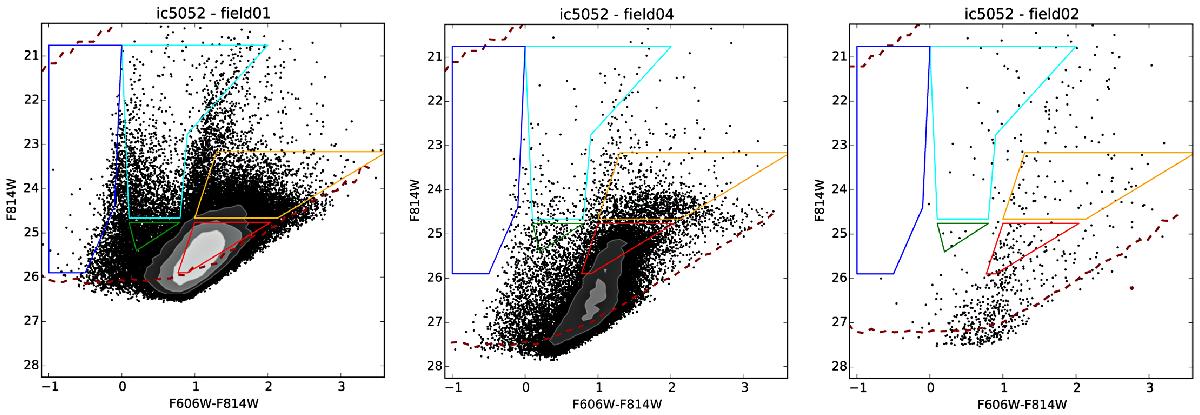
Color-magnitude diagrams from three fields in IC 5052. We show a field from the central disk (left), the outer disk (middle), and the halo (right). Dense regions in the CMD are plotted as a Hess diagram with contours at 100, 200, 400, and 800 stars per (0.1 mag)2. Colored boxes are the selection boxes for the populations defined in Sect. 2.2, and the red dashed line is the 50% completeness level of the observations.
Current usage metrics show cumulative count of Article Views (full-text article views including HTML views, PDF and ePub downloads, according to the available data) and Abstracts Views on Vision4Press platform.
Data correspond to usage on the plateform after 2015. The current usage metrics is available 48-96 hours after online publication and is updated daily on week days.
Initial download of the metrics may take a while.