Free Access
Fig. 15
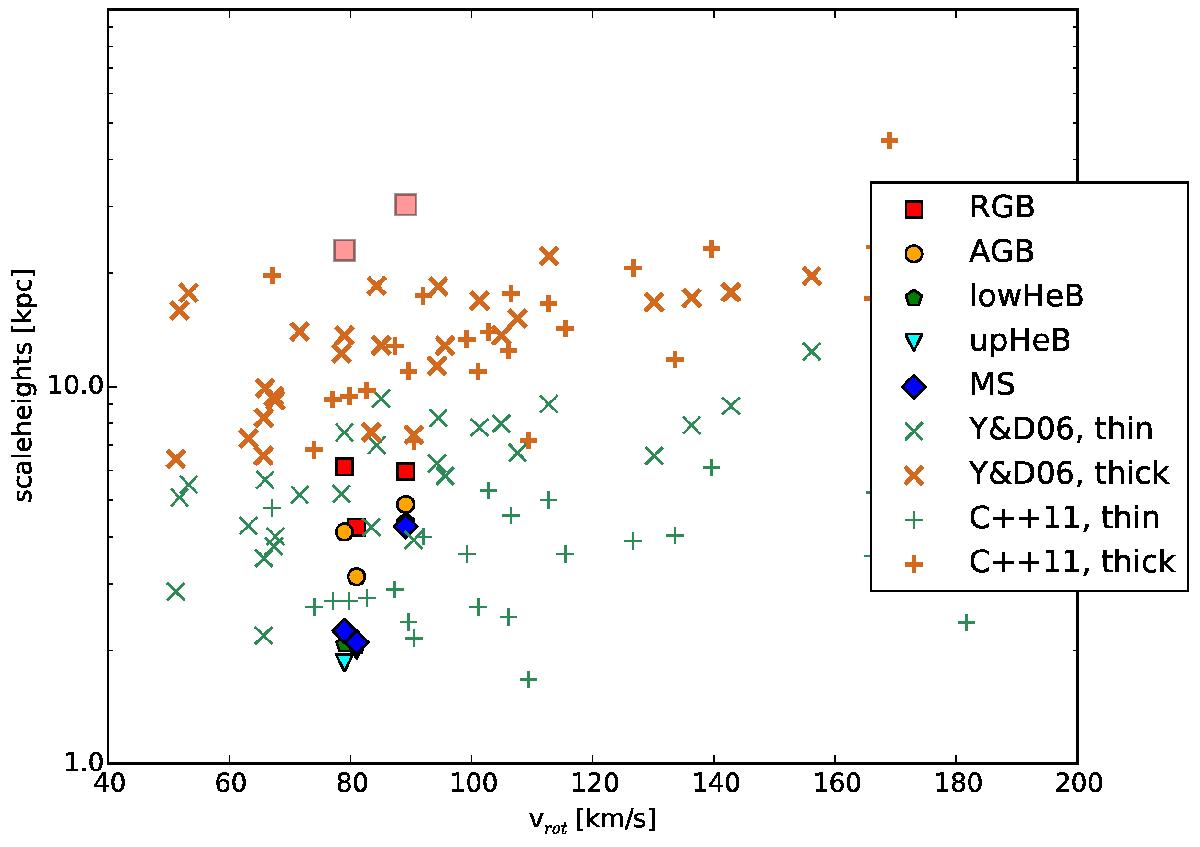
Comparison of our measured scale heights with data from Yoachim & Dalcanton (2006) and Comerón et al. (2011a). The colored circles show our results for the different populations (color code as before); squares show the faint extended component (Sect. 3.3.2).
Current usage metrics show cumulative count of Article Views (full-text article views including HTML views, PDF and ePub downloads, according to the available data) and Abstracts Views on Vision4Press platform.
Data correspond to usage on the plateform after 2015. The current usage metrics is available 48-96 hours after online publication and is updated daily on week days.
Initial download of the metrics may take a while.