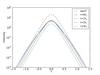
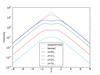
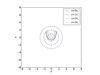
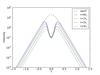
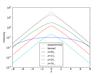
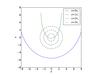
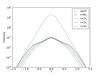
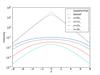
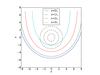
Fig. 14
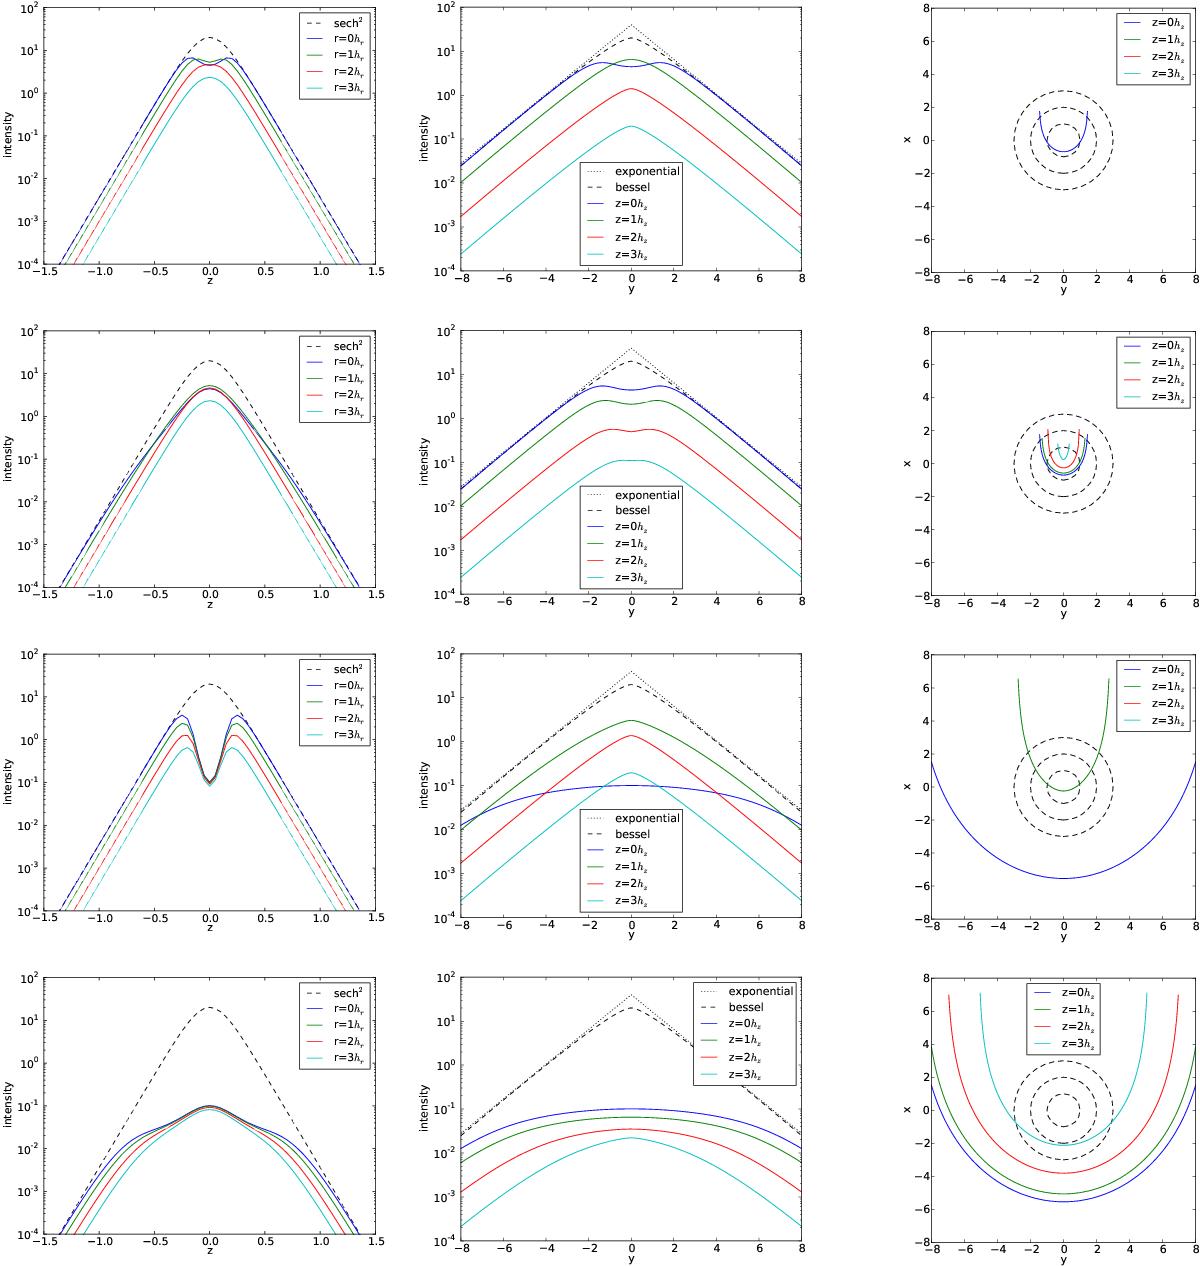
Effects of dust on ideal galaxy models; Each row shows a model of different dust properties, from top to bottom they are defined by (hz,dust,hr,dust) = (0.1, 0.5) (0.4, 0.5), (0.1, 2.), and (0.4, 2.). Left column: vertical profiles at different radial positions (as given in the legend in terms of stellar scale length); middle column: radial profile at different heights above the plane (see legend, given in stellar scale heights); right column: face-on view of the position where the optical depth reaches one (τ = 1) for different heights above the plane (see legend, given in stellar scale heights); the dashed lines are circles of one, two, and three scale lengths of the stellar component.
Current usage metrics show cumulative count of Article Views (full-text article views including HTML views, PDF and ePub downloads, according to the available data) and Abstracts Views on Vision4Press platform.
Data correspond to usage on the plateform after 2015. The current usage metrics is available 48-96 hours after online publication and is updated daily on week days.
Initial download of the metrics may take a while.