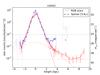
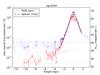
Fig. 13
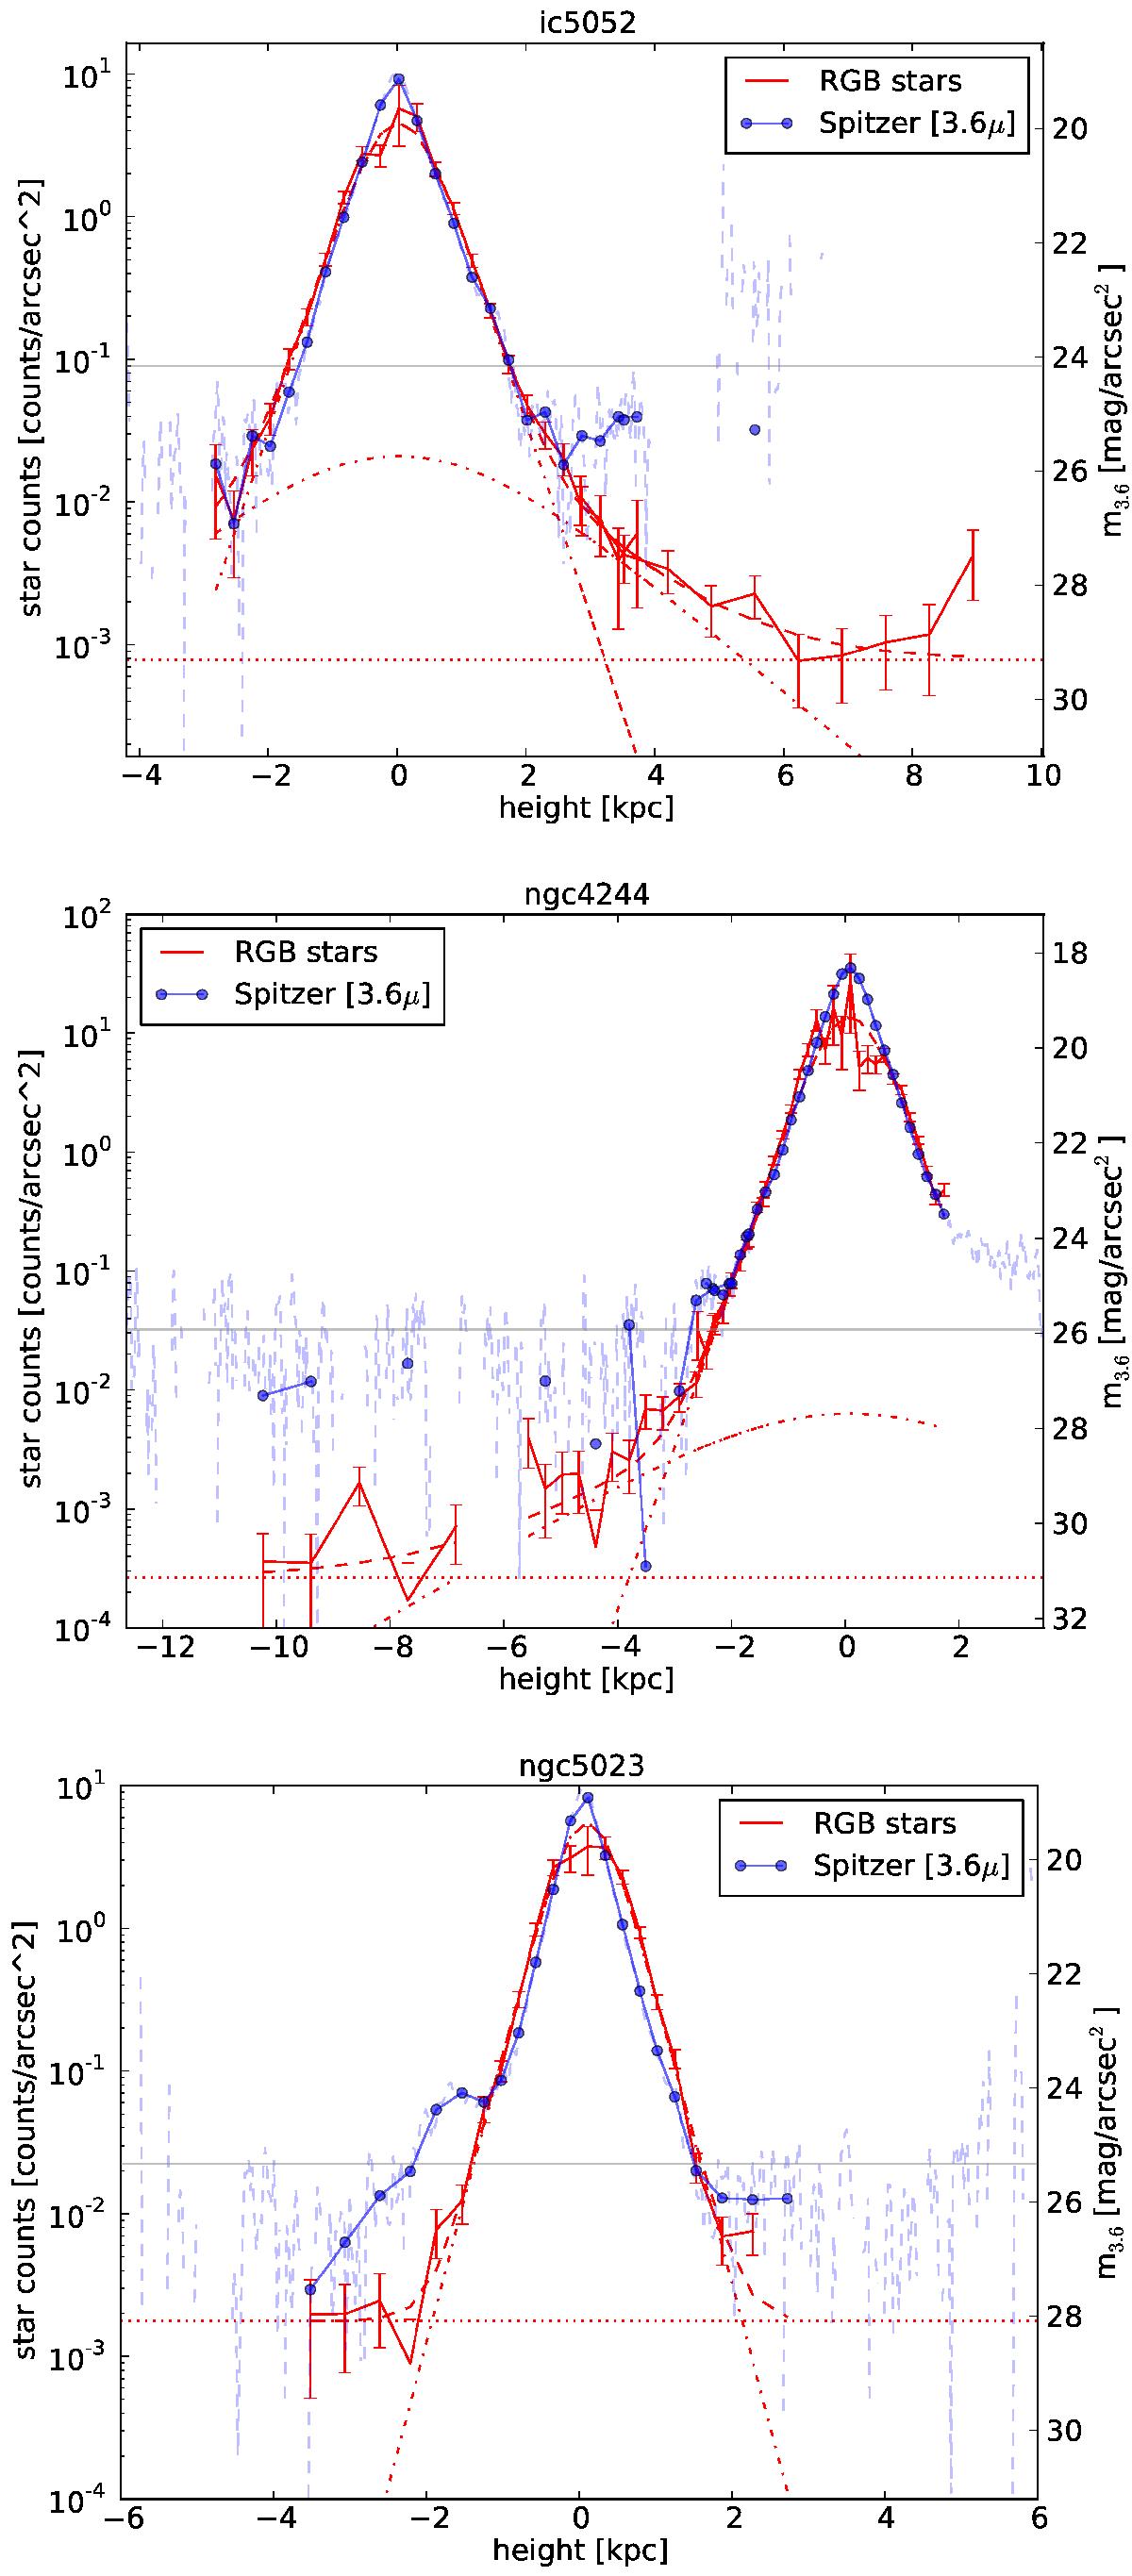
Surface number density profiles of RGB stars in the central regions of the three galaxies (shown in red), the dashed lines are the best-fit models, the dash-dotted lines show the different components, two sech2 functions, and a constant for background contamination. The light blue dashed line is the (background-subtracted) surface brightness in the Spitzer 3.6 μm filter, the solid blue line shows the Spitzer data averaged to the same bin size as the star count data, and the horizontal gray line plots the estimated noise level of the background of the Spitzer data.
Current usage metrics show cumulative count of Article Views (full-text article views including HTML views, PDF and ePub downloads, according to the available data) and Abstracts Views on Vision4Press platform.
Data correspond to usage on the plateform after 2015. The current usage metrics is available 48-96 hours after online publication and is updated daily on week days.
Initial download of the metrics may take a while.