Fig. 12
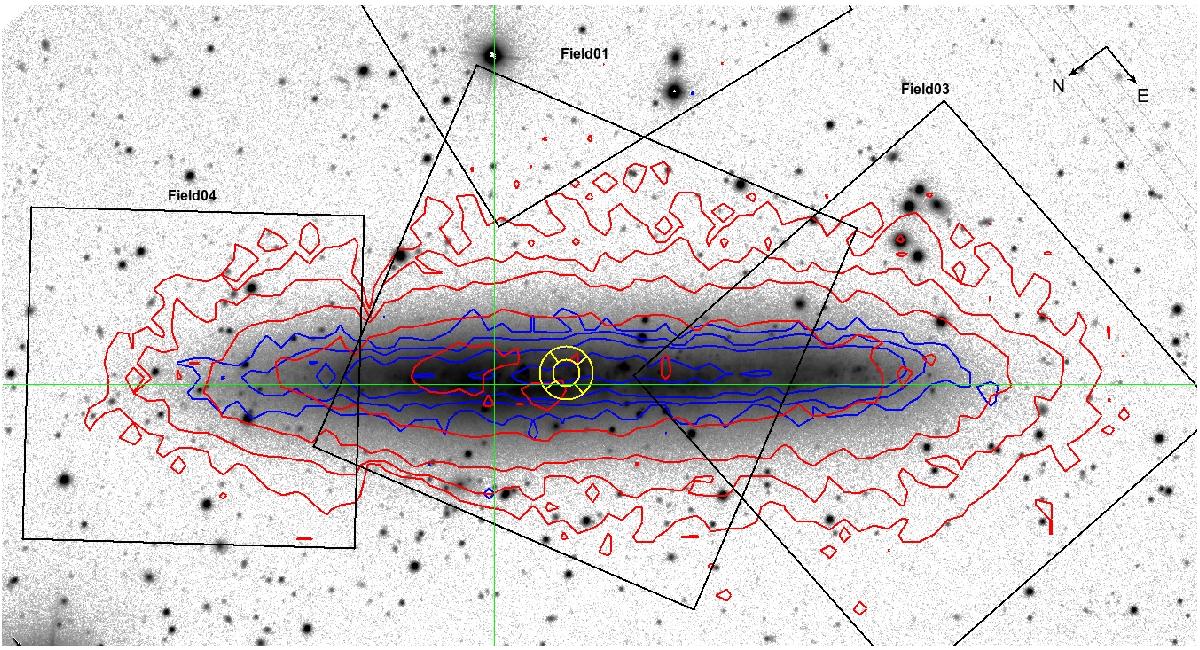
R-band image of IC 5052 (Meurer et al. 2006). The density of RGB stars is shown as red contours, the density of young stars as blue contours. The yellow reticle indicates the dynamic center of the H i gas (Peters et al. 2013), the green cross shows the central position of the galaxy from HyperLEDA. The black boxes show the (approximate) coverage of our GHOSTS fields.
Current usage metrics show cumulative count of Article Views (full-text article views including HTML views, PDF and ePub downloads, according to the available data) and Abstracts Views on Vision4Press platform.
Data correspond to usage on the plateform after 2015. The current usage metrics is available 48-96 hours after online publication and is updated daily on week days.
Initial download of the metrics may take a while.