Fig. 1
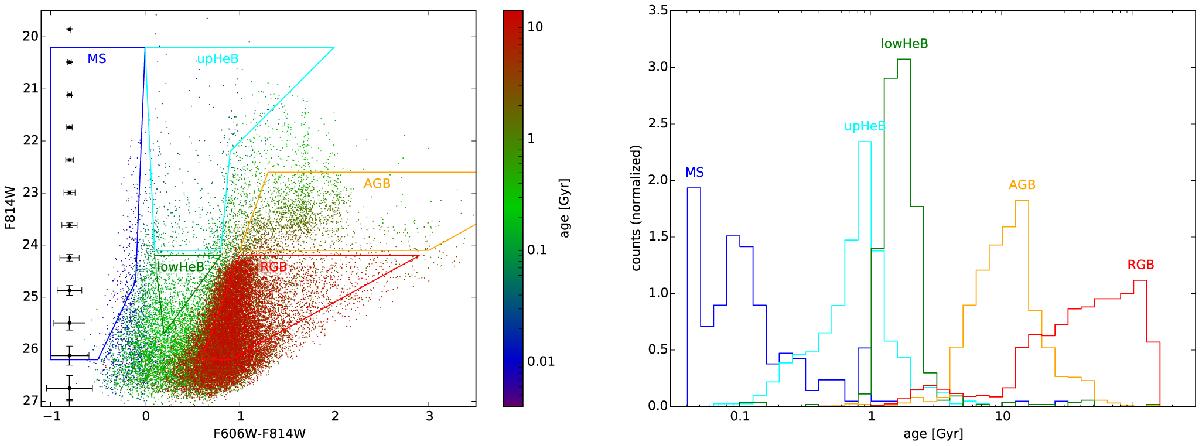
Left panel: an artificial CMD generated with a constant star formation rate and a flat metallicity distribution function (−2.2 < [Z] < 0.2). The colored boxes are the population boxes as described in the text. Stars are colored according to their age (see color bar). Right panel: age distribution of stars in the five population boxes in the left figure.
Current usage metrics show cumulative count of Article Views (full-text article views including HTML views, PDF and ePub downloads, according to the available data) and Abstracts Views on Vision4Press platform.
Data correspond to usage on the plateform after 2015. The current usage metrics is available 48-96 hours after online publication and is updated daily on week days.
Initial download of the metrics may take a while.