Free Access
Fig. 6
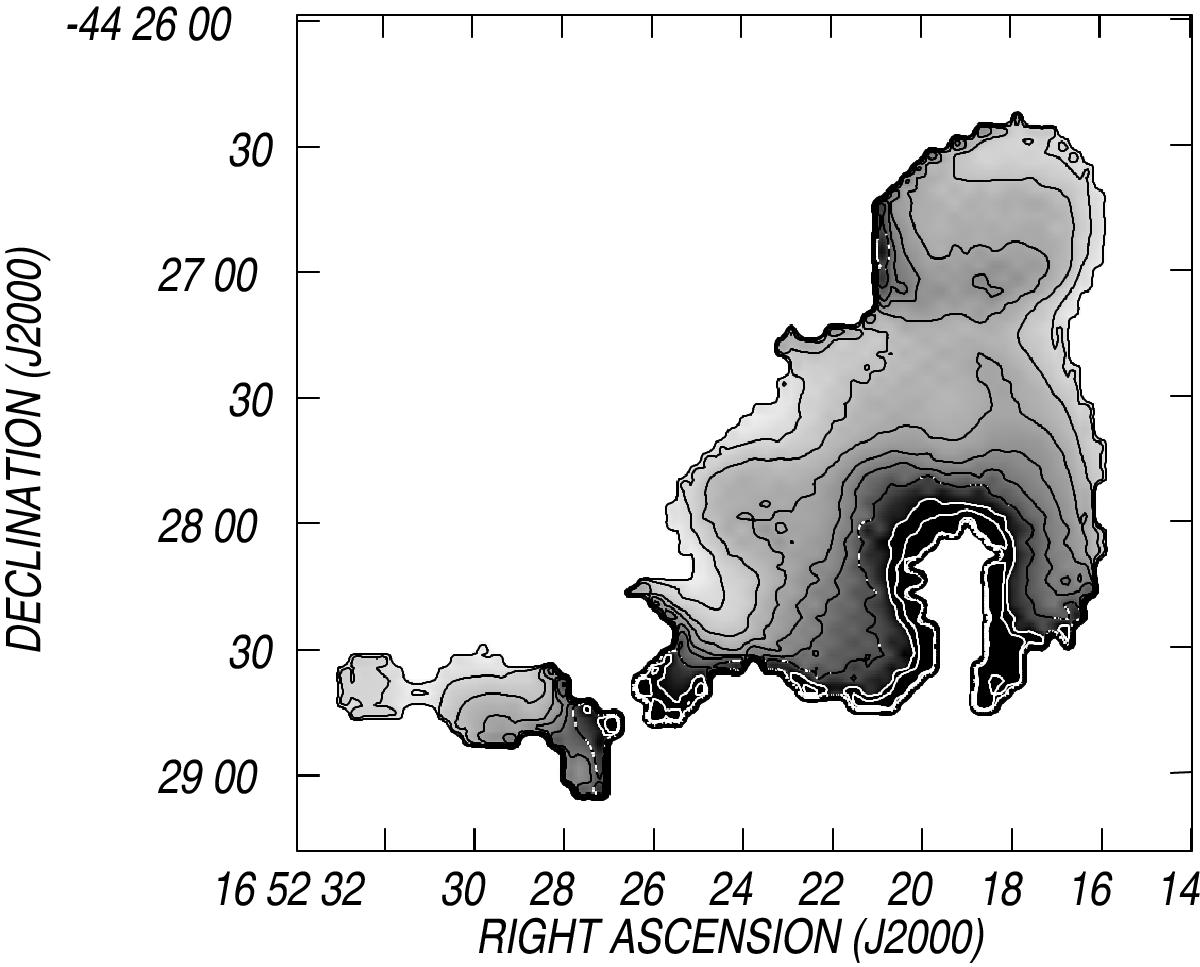
Dust temperature map derived from the Herschel emission at 70 and 160 μm. The grayscale extends from 20 to 50 K. Contour levels correspond to 20 to 32 K in steps of 3 K, 35, 40, 50, and 60 K. The darkest regions indicate the highest dust temperatures.
Current usage metrics show cumulative count of Article Views (full-text article views including HTML views, PDF and ePub downloads, according to the available data) and Abstracts Views on Vision4Press platform.
Data correspond to usage on the plateform after 2015. The current usage metrics is available 48-96 hours after online publication and is updated daily on week days.
Initial download of the metrics may take a while.