Fig. 2
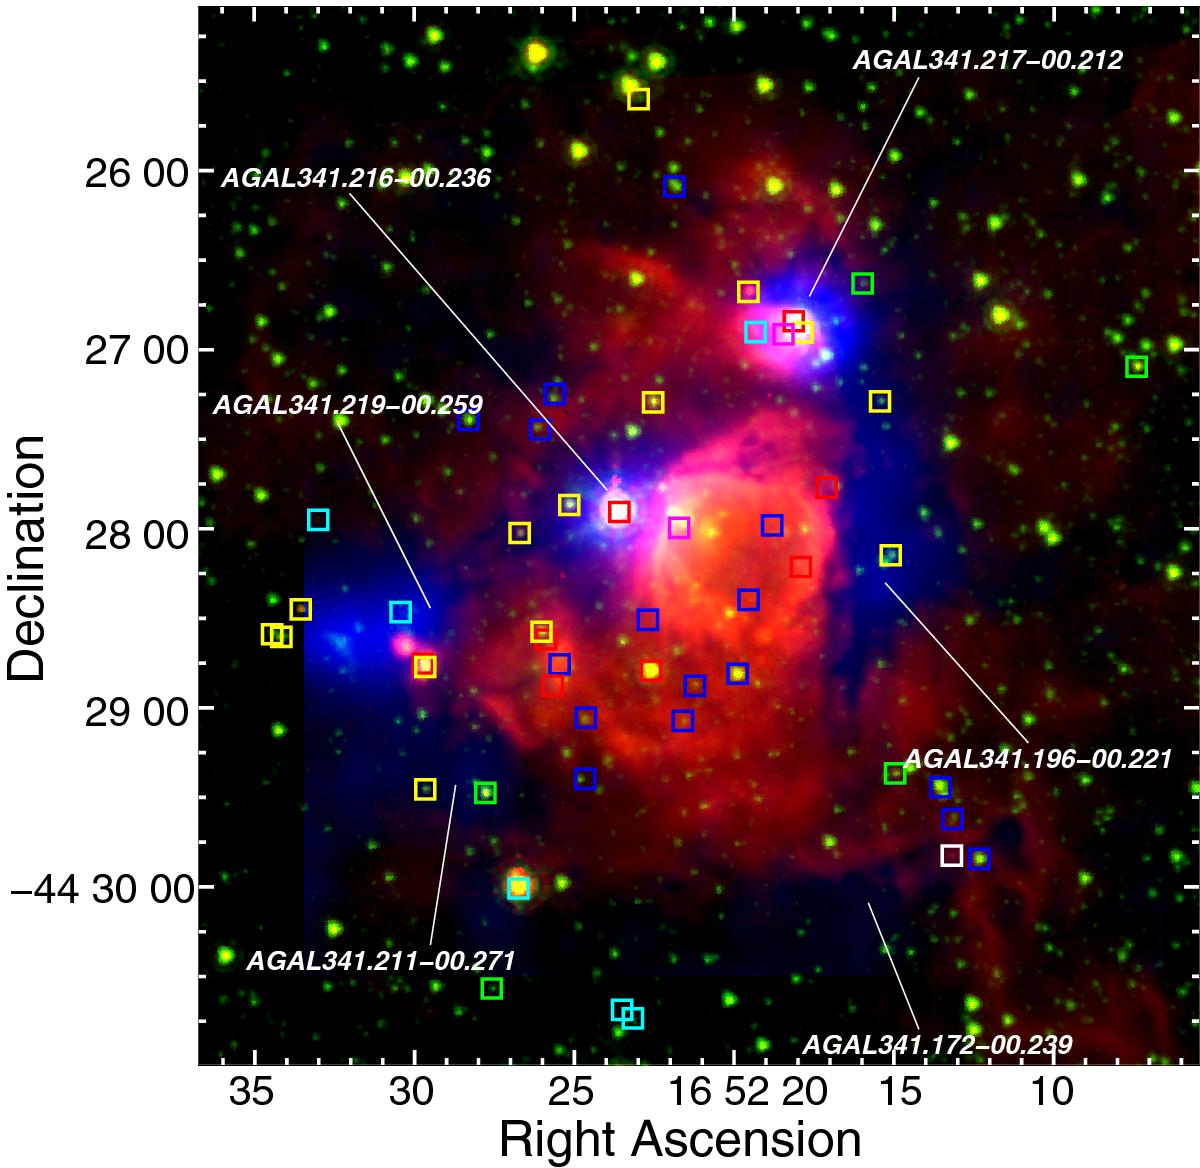
Overlay of the IRAC emissions at 8 μm (in red) and 3.6 μm (in green) and the LABOCA emission at 870 μm (in blue). Positions of identified YSOs are indicated with squares in different colors: Class I (red) and Class II (blue) sources from the WISE database, Class I (yellow), Class II (white), and Class I/II (green) sources from the Spitzer database, 2MASS sources (cyan), and MSX sources (magenta). Dust clumps from Contreras et al. (2013) are indicated.
Current usage metrics show cumulative count of Article Views (full-text article views including HTML views, PDF and ePub downloads, according to the available data) and Abstracts Views on Vision4Press platform.
Data correspond to usage on the plateform after 2015. The current usage metrics is available 48-96 hours after online publication and is updated daily on week days.
Initial download of the metrics may take a while.