Free Access
Fig. 16
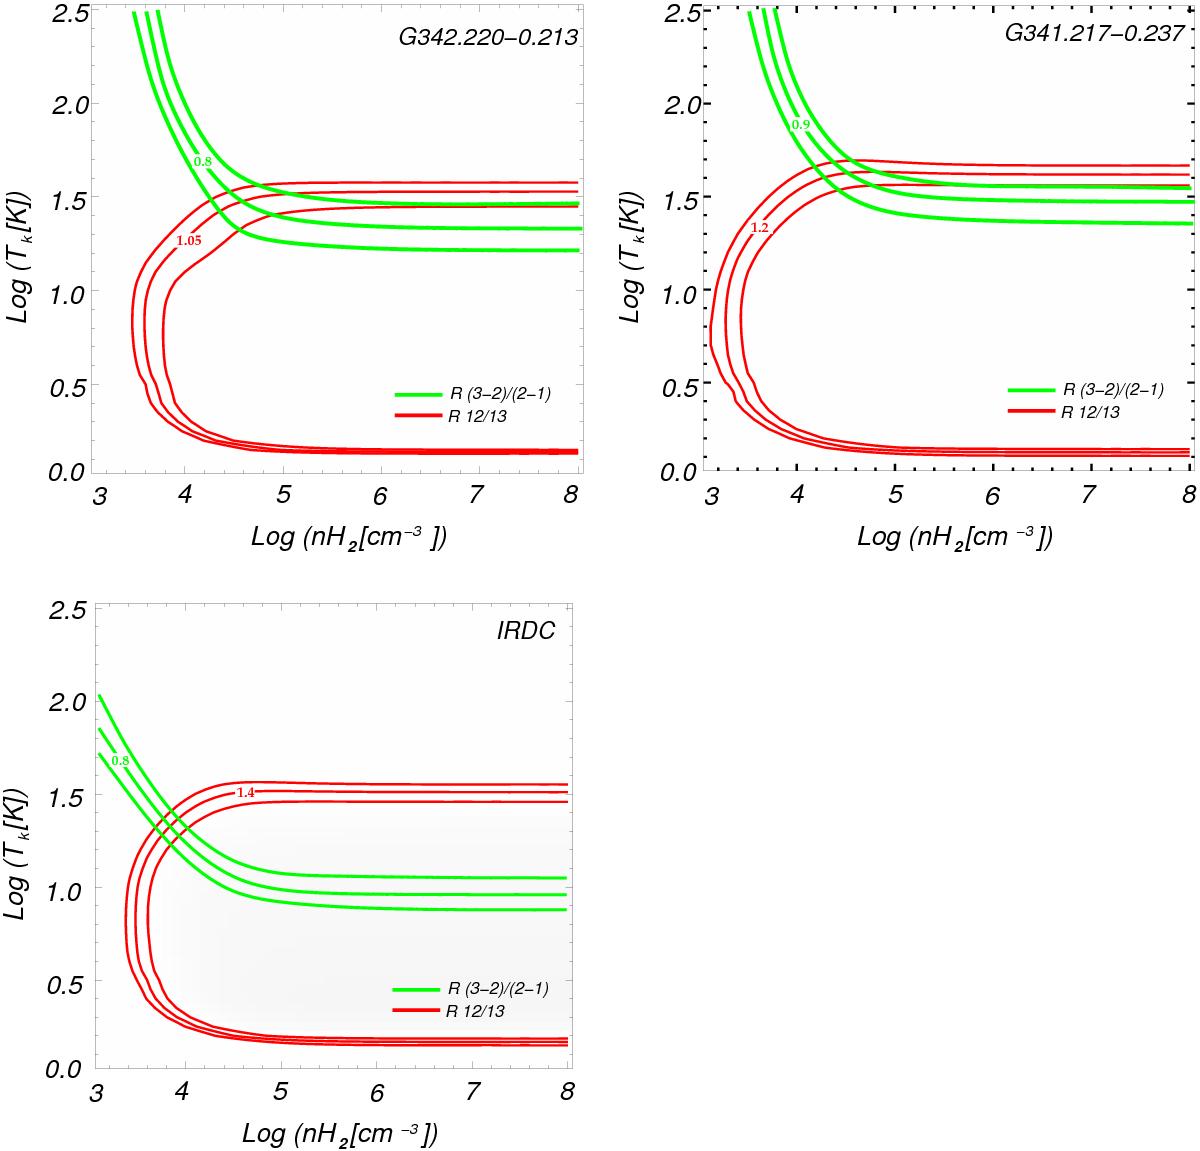
LVG plots for G341.220-0.213, G341.217-0.237, and the IRDC SDC341.194-0.221. The green lines show the solutions for the ratios 13CO(3−2)/13CO(2−1), red lines those for 13CO(2−1)/CO(2−1). The central lines correspond to the observed ratios. The outer lines indicate ~10% calibration uncertainties.
Current usage metrics show cumulative count of Article Views (full-text article views including HTML views, PDF and ePub downloads, according to the available data) and Abstracts Views on Vision4Press platform.
Data correspond to usage on the plateform after 2015. The current usage metrics is available 48-96 hours after online publication and is updated daily on week days.
Initial download of the metrics may take a while.