Fig. 14
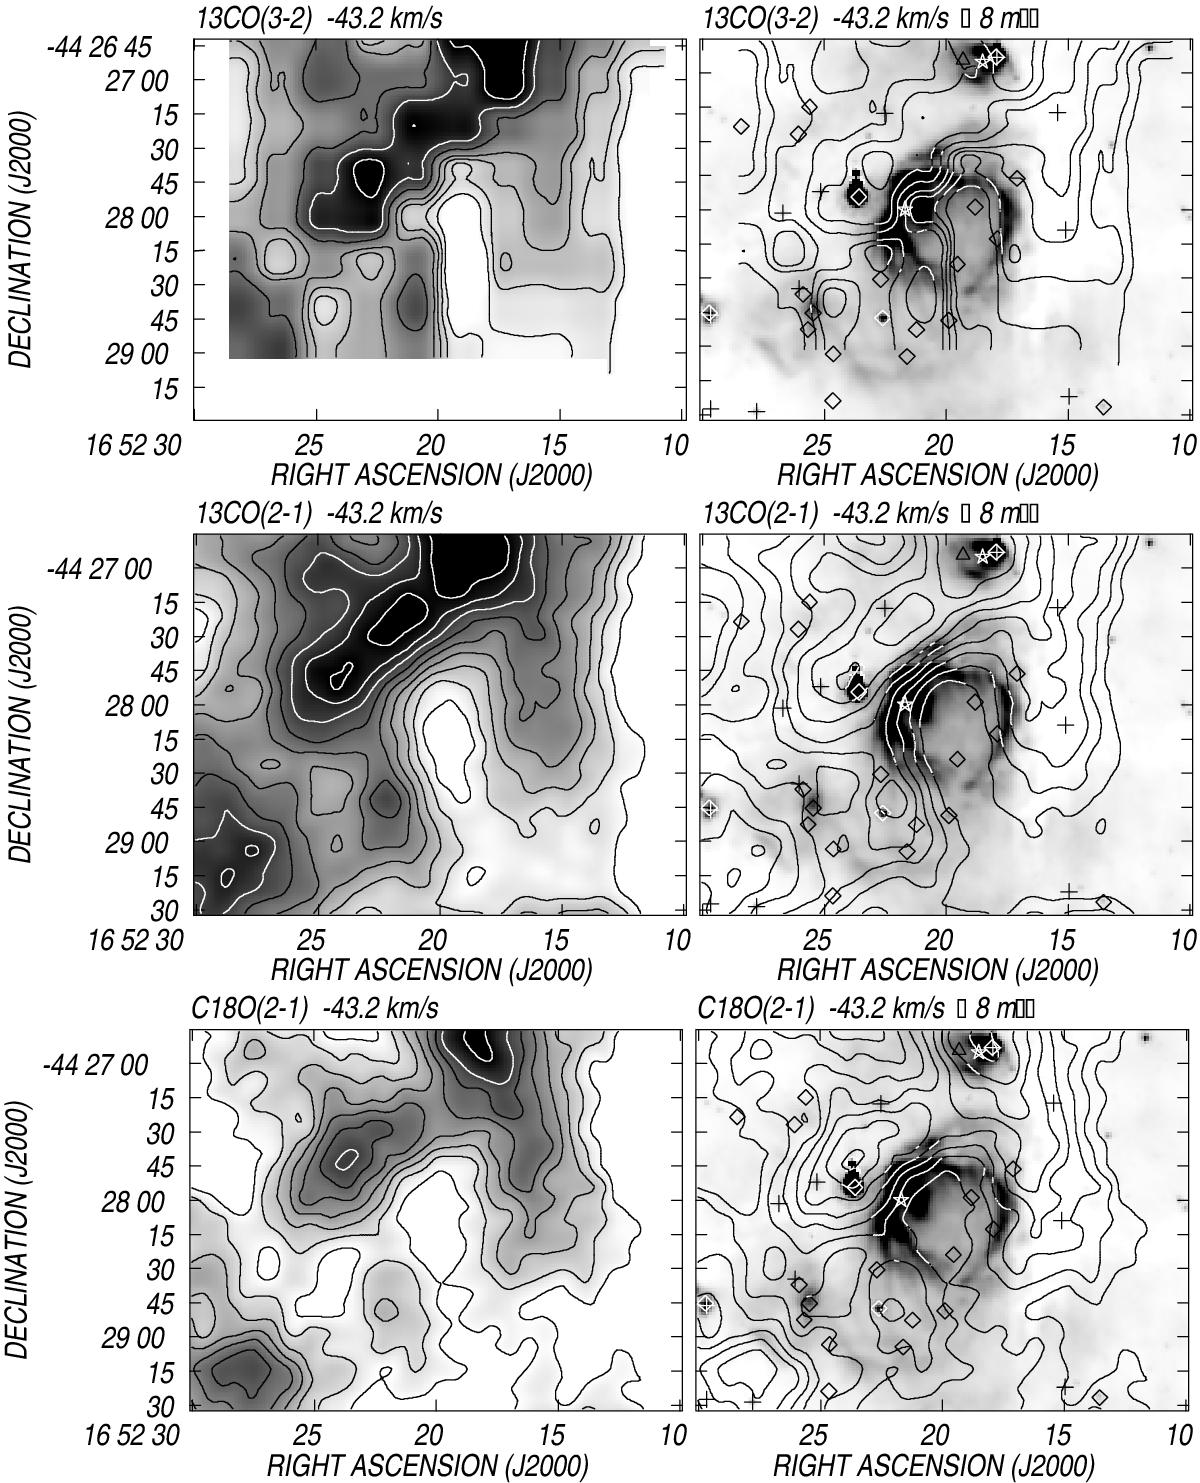
Upper panels: left: 13CO(3−2) emission distribution at −43.2 km s-1 showing the molecular envelope around the S 24 bubble. Contours are 3.0 K to 6.0 K (Tmb) in steps of 1.0 K, 8.0 K, 10.0 K, and 12.0 K. Right: overlay of the same contours as in the left panel and the IRAC emission at 8 μm. The symbols have the same meaning as in Fig. 12. Middle panels: Left: 13CO(2−1) emission distribution at −43.2 km s-1. Contours are from 4.0 K to 12.0 K (Tmb) in steps of 1.0 K. Right: overlay of the same contours as in the left panel and the IRAC emission at 8 μm. Bottom panels: left: C13O(2−1) emission distribution at −43.2 km s-1. Contours are from 1.0 K to 4.0 K (Tmb) in steps of 0.5 K, and 5 K. Right: overlay of the same contours as in the left panel and the IRAC emission at 8 μm.
Current usage metrics show cumulative count of Article Views (full-text article views including HTML views, PDF and ePub downloads, according to the available data) and Abstracts Views on Vision4Press platform.
Data correspond to usage on the plateform after 2015. The current usage metrics is available 48-96 hours after online publication and is updated daily on week days.
Initial download of the metrics may take a while.