Fig. 13
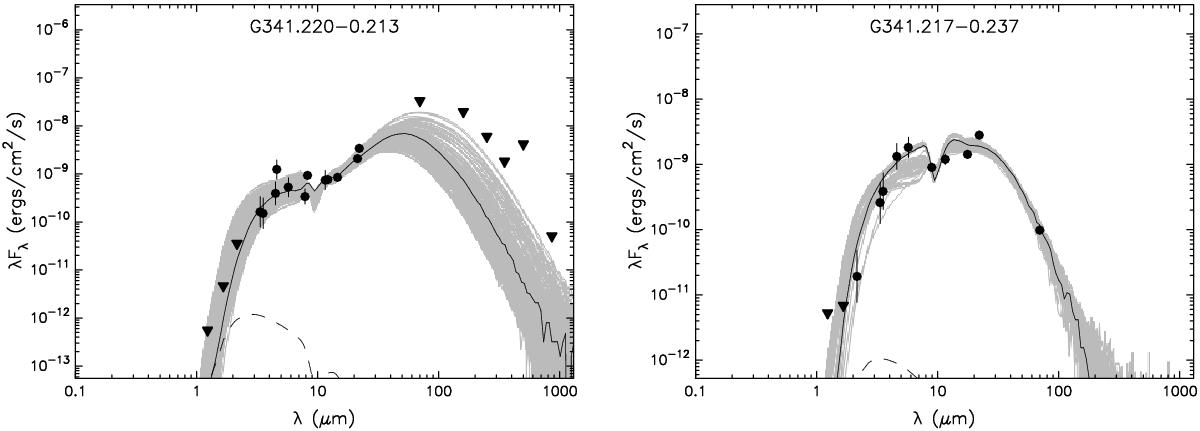
Left panel: SED of YSOs from Table 1 in G341.220-0.213. Input data are indicated by filled circles. The triangles indicate upper limits. The black line corresponds to the best fit. The fittings that obey Eq. (1) appear indicated by gray lines. The dashed line shows the emission of the stellar photosphere including foreground interstellar extinction. Right panel: SED of source #43 from Table 1 in G341.217-0.237.
Current usage metrics show cumulative count of Article Views (full-text article views including HTML views, PDF and ePub downloads, according to the available data) and Abstracts Views on Vision4Press platform.
Data correspond to usage on the plateform after 2015. The current usage metrics is available 48-96 hours after online publication and is updated daily on week days.
Initial download of the metrics may take a while.