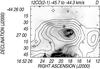
Fig. 12
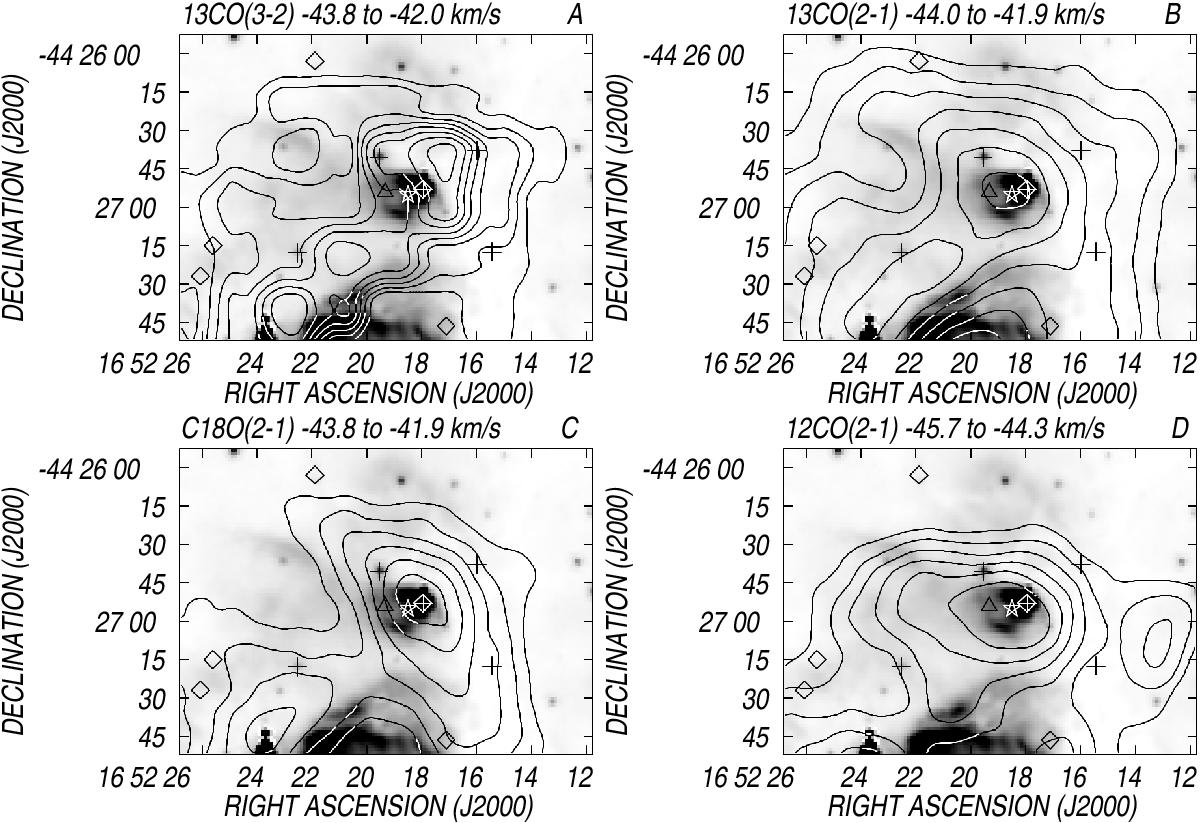
Panels A)−D): overlay of the CO emission distribution in contours and the emission at 8 μm in grayscale towards G341.220-0.213. Panel A): 13CO(3−2) line emission in the interval from −43.8 km s-1 to −42.0 km s-1. Contours are from 5 K to 12 K (Tmb) in steps of 1 K. the different symbols mark the position of YSO candidates: stars: MSX sources, triangles: 2MASS sources, crosses: Spitzer sources, diamonds: WISE sources. Panel B): 13CO(2−1) line emission in the interval from −44.0 km s-1 to −41.9 km s-1. Contours are from 5 K to 11 K (Tmb) in steps of 1 K. Panel C): C18O(2−1) line emission in the interval from −43.8 km s-1 to −41.9 km s-1. Contours are from 1.5 K to 4 K (Tmb) in steps of 0.5 K. Panel D): 12CO(2−1) line emission in the interval from −45.7 km s-1 to −44.3 km s-1. Contours are from 9 K to 14 K (Tmb) in steps of 1 K.
Current usage metrics show cumulative count of Article Views (full-text article views including HTML views, PDF and ePub downloads, according to the available data) and Abstracts Views on Vision4Press platform.
Data correspond to usage on the plateform after 2015. The current usage metrics is available 48-96 hours after online publication and is updated daily on week days.
Initial download of the metrics may take a while.