Fig. 9
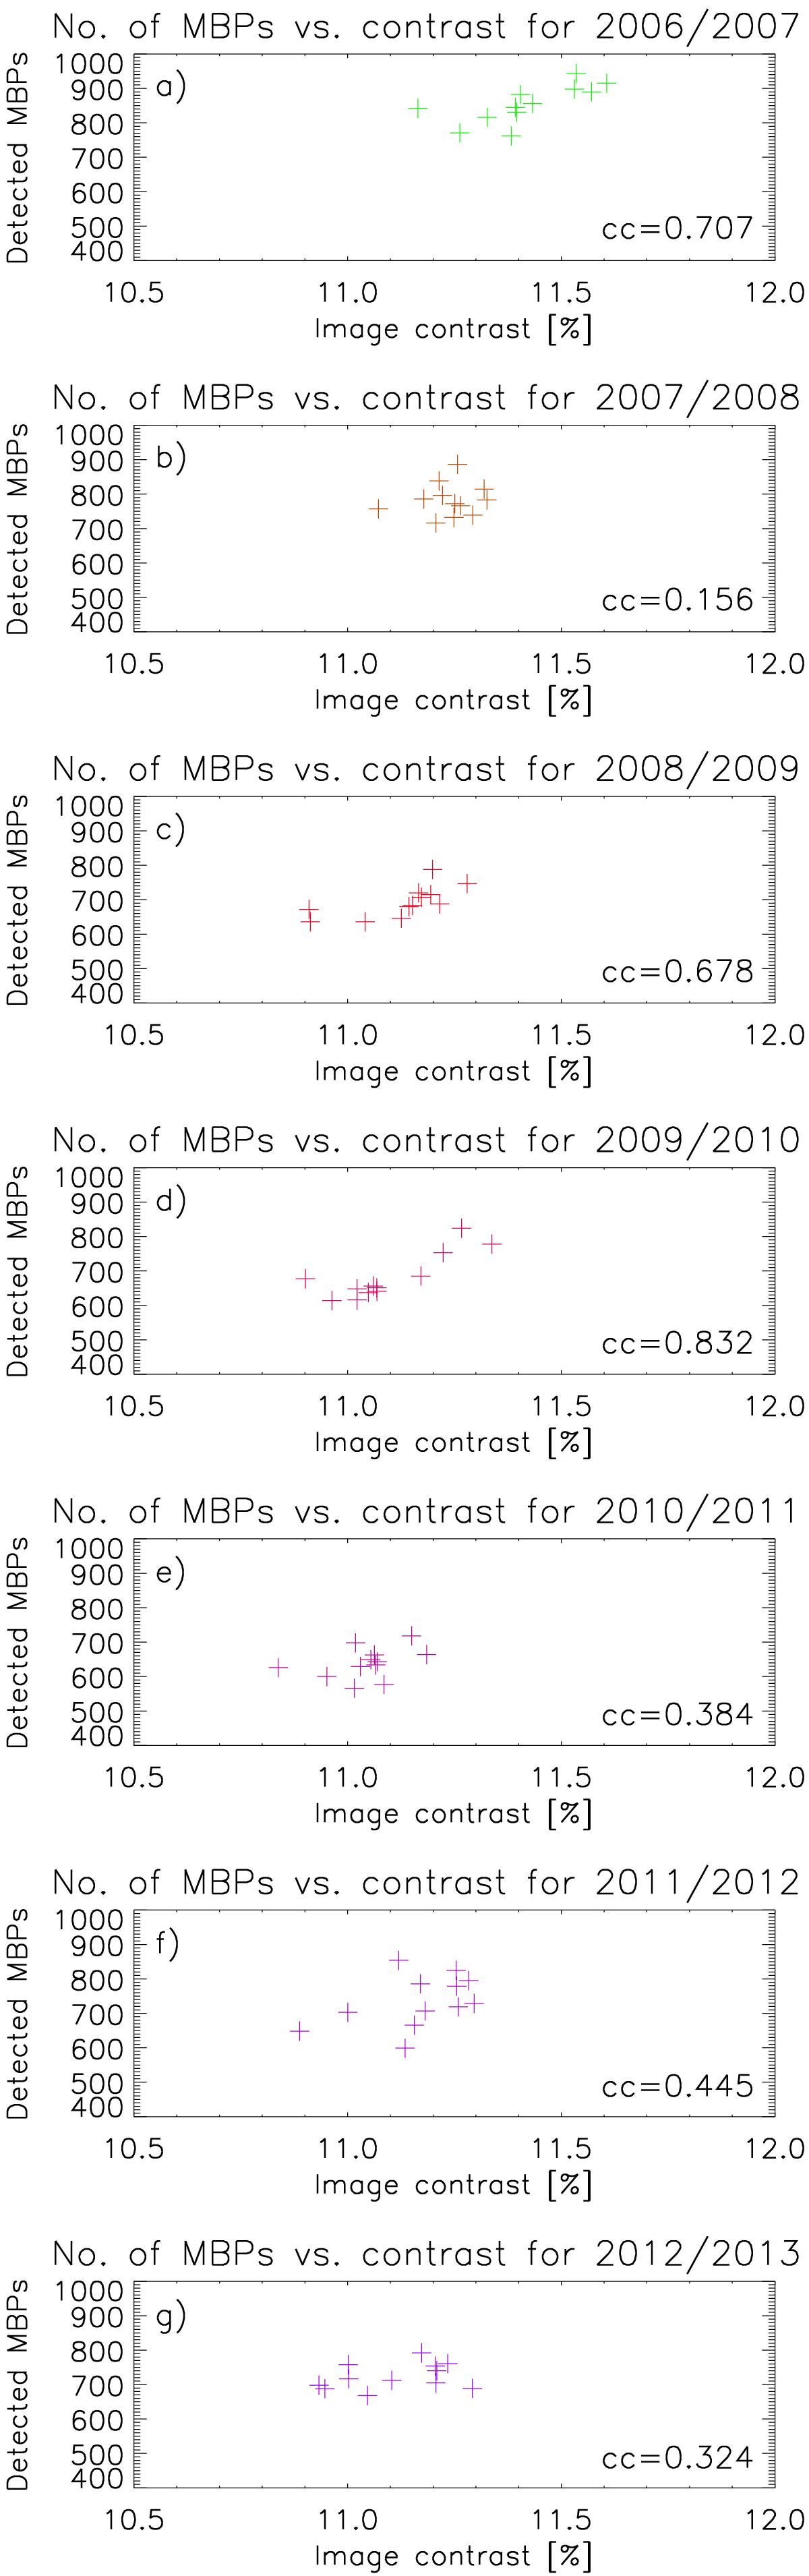
Scatter plots of the monthly median number of detected MBPs per image versus image contrast, separately plotted for successive periods of 1 yr. Each period is from November to October of the following year. The correlation coefficient between the number of detected MBPs and the image contrast is annotated in the lower right corner.
Current usage metrics show cumulative count of Article Views (full-text article views including HTML views, PDF and ePub downloads, according to the available data) and Abstracts Views on Vision4Press platform.
Data correspond to usage on the plateform after 2015. The current usage metrics is available 48-96 hours after online publication and is updated daily on week days.
Initial download of the metrics may take a while.