Fig. 8
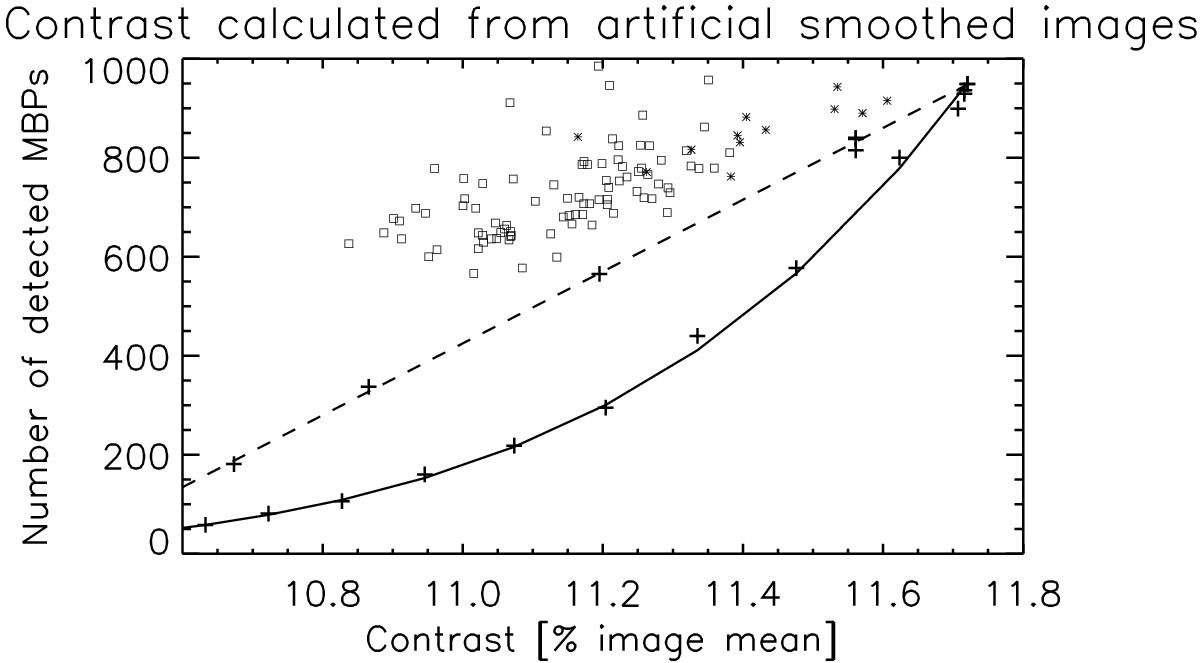
Relationship between the number of identified MBPs and the image contrast obtained via artificially defocusing an image by convolving the image with a Gaussian featuring a variable width. The solid line depicts the relationship for an image taken early during the mission. Crosses demark the image contrast and the number of identified MBPs for the defocused images (always based on the same original image). The dashed line illustrates the same behaviour for a second test case using a Voigt profile for the artificial defocusing. For comparison, all analysed images (those images featuring the monthly median MBP number) from the original data set are plotted, with stars depicting the first year (strongest instrument ageing) and squares for the rest of the analysed time period.
Current usage metrics show cumulative count of Article Views (full-text article views including HTML views, PDF and ePub downloads, according to the available data) and Abstracts Views on Vision4Press platform.
Data correspond to usage on the plateform after 2015. The current usage metrics is available 48-96 hours after online publication and is updated daily on week days.
Initial download of the metrics may take a while.