Fig. 7
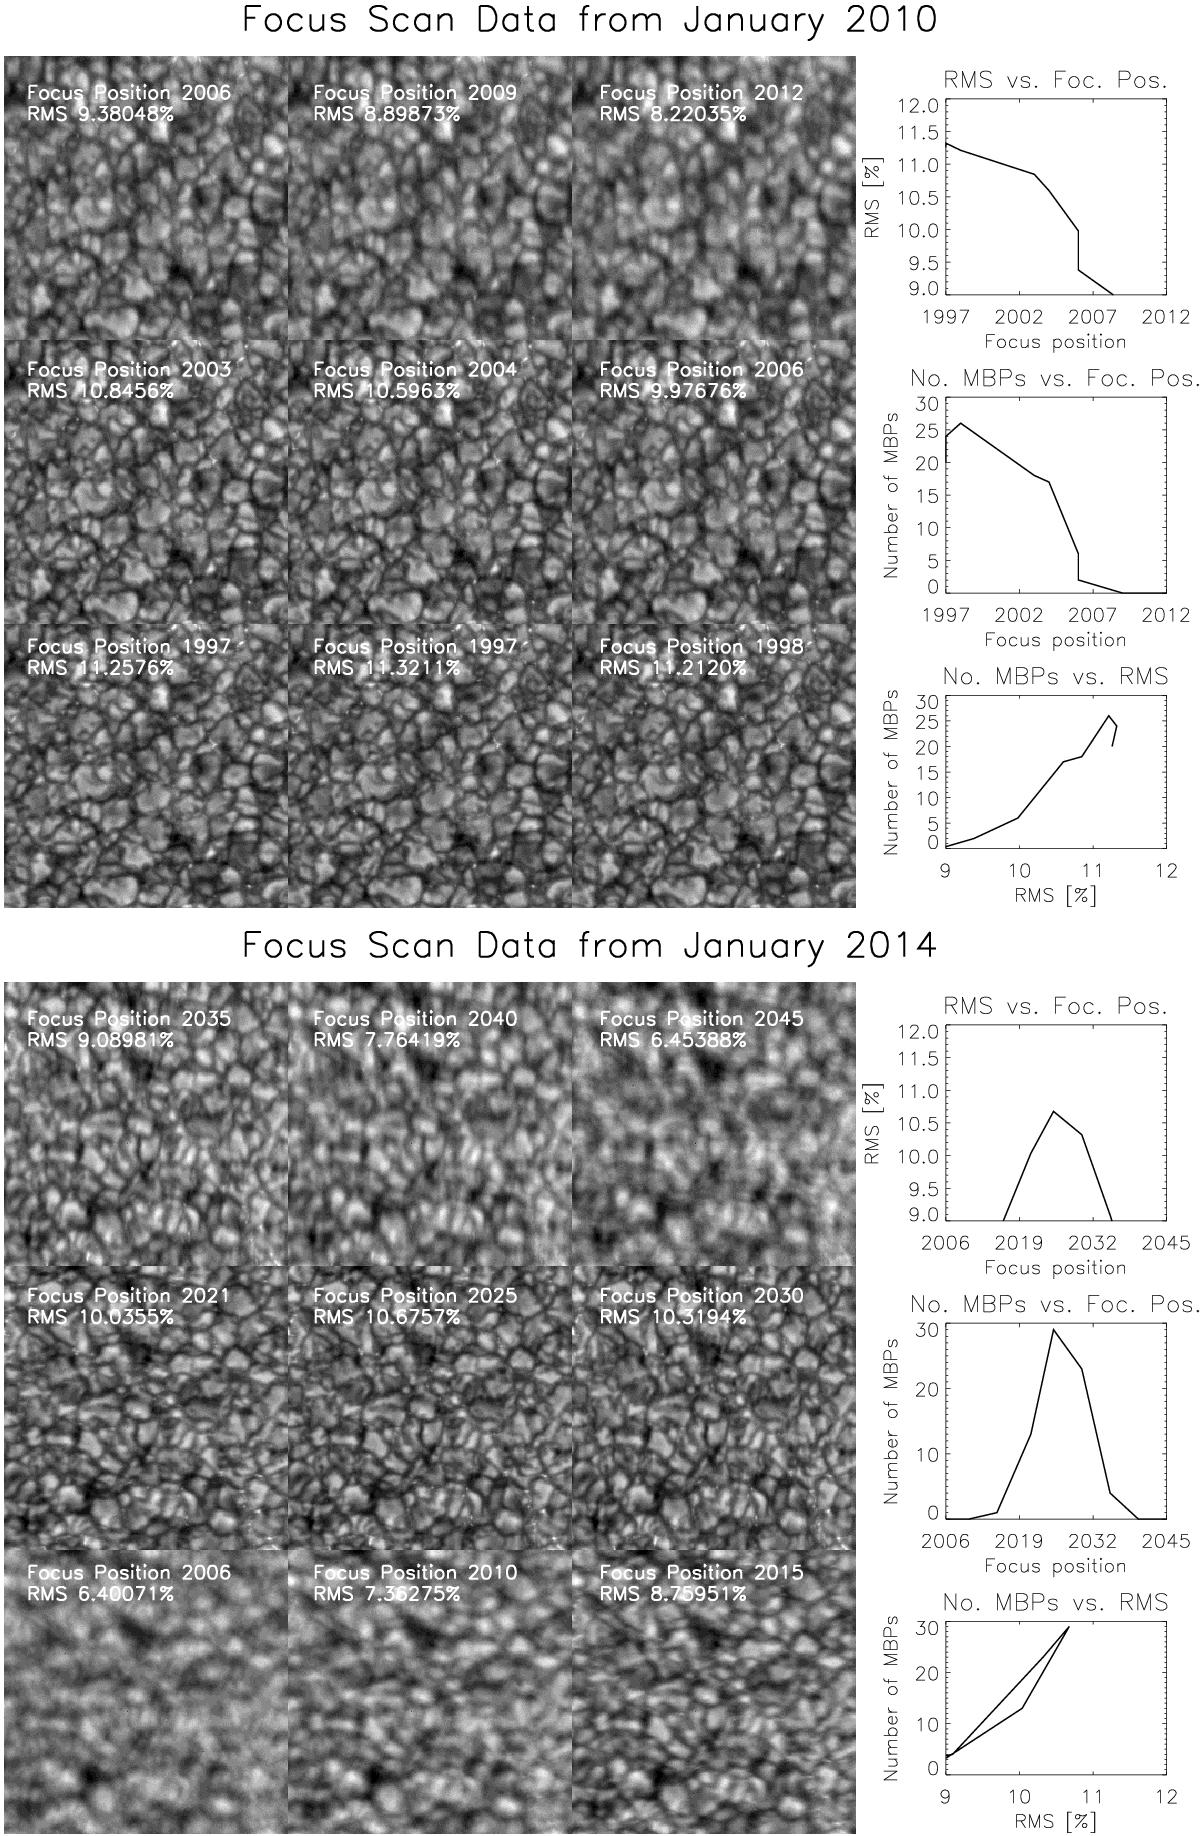
Two examples of Hinode/SOT G-band focus scan data. Upper half: focus scan from January 2010. The nine-image mosaic displays the exposures recorded during the scan at different focus positions. The three panels to the right illustrate the dependence of the image contrast on the focus position, the number of detected MBPs versus the focus position, and the number of MBPs versus the image contrast. The lower half shows the same for the focus scan taken in January 2014.
Current usage metrics show cumulative count of Article Views (full-text article views including HTML views, PDF and ePub downloads, according to the available data) and Abstracts Views on Vision4Press platform.
Data correspond to usage on the plateform after 2015. The current usage metrics is available 48-96 hours after online publication and is updated daily on week days.
Initial download of the metrics may take a while.