Fig. 6
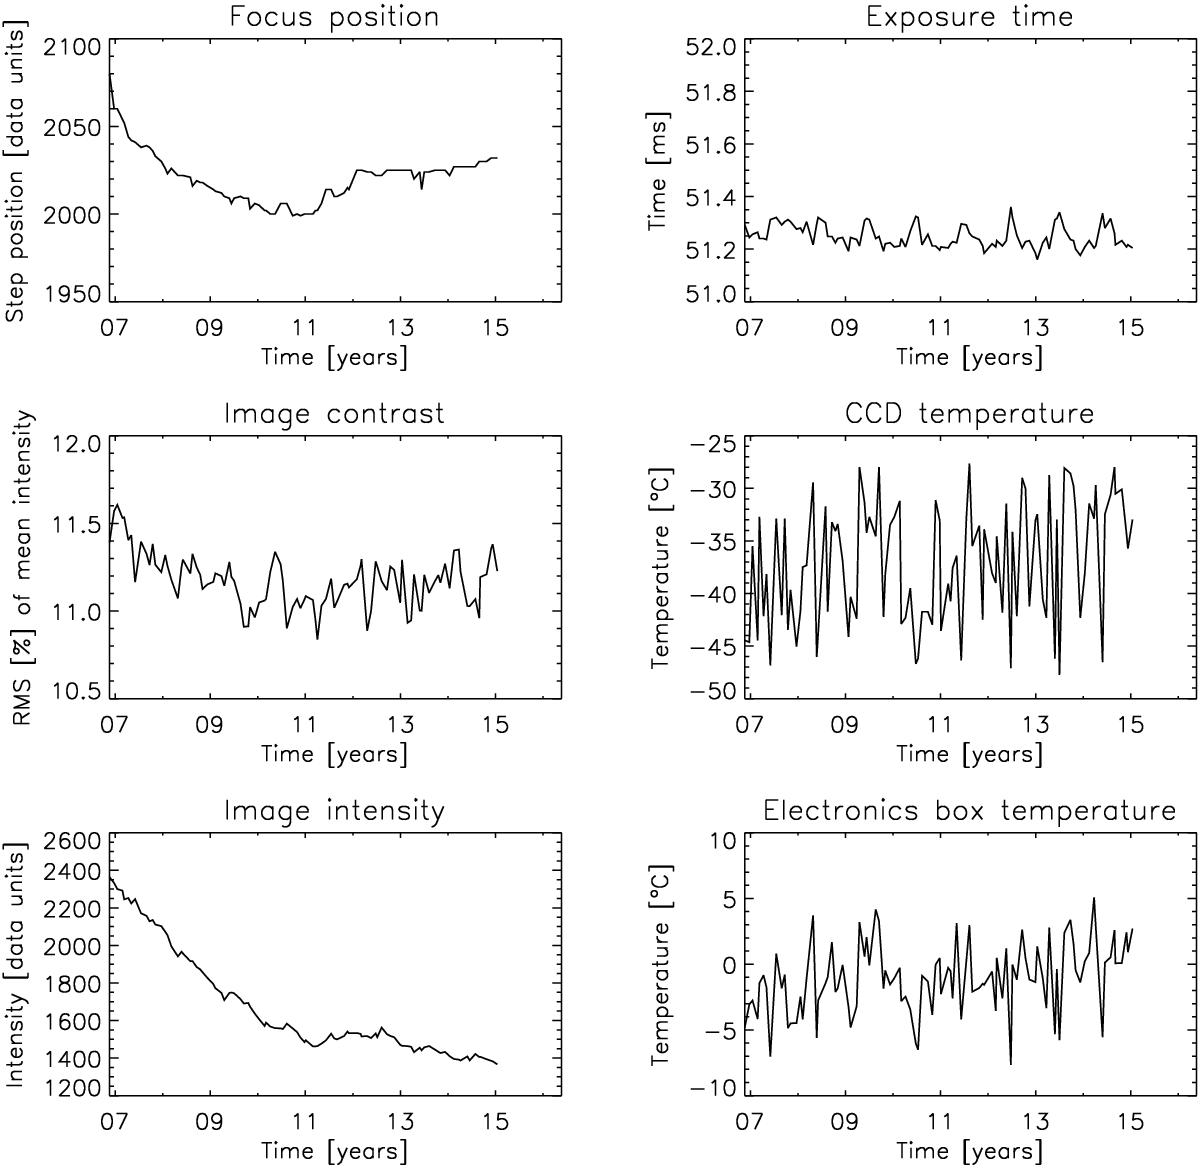
Characteristic quantities describing the long-term instrument stability of the Hinode/SOT G-band filter. Left column (from top to bottom): the focus position used to record the image, the image contrast achieved, and the mean image intensity; right column: the exposure time, the CCD temperature, and the electronics box temperature during the time when the image was recorded.
Current usage metrics show cumulative count of Article Views (full-text article views including HTML views, PDF and ePub downloads, according to the available data) and Abstracts Views on Vision4Press platform.
Data correspond to usage on the plateform after 2015. The current usage metrics is available 48-96 hours after online publication and is updated daily on week days.
Initial download of the metrics may take a while.