Fig. 4
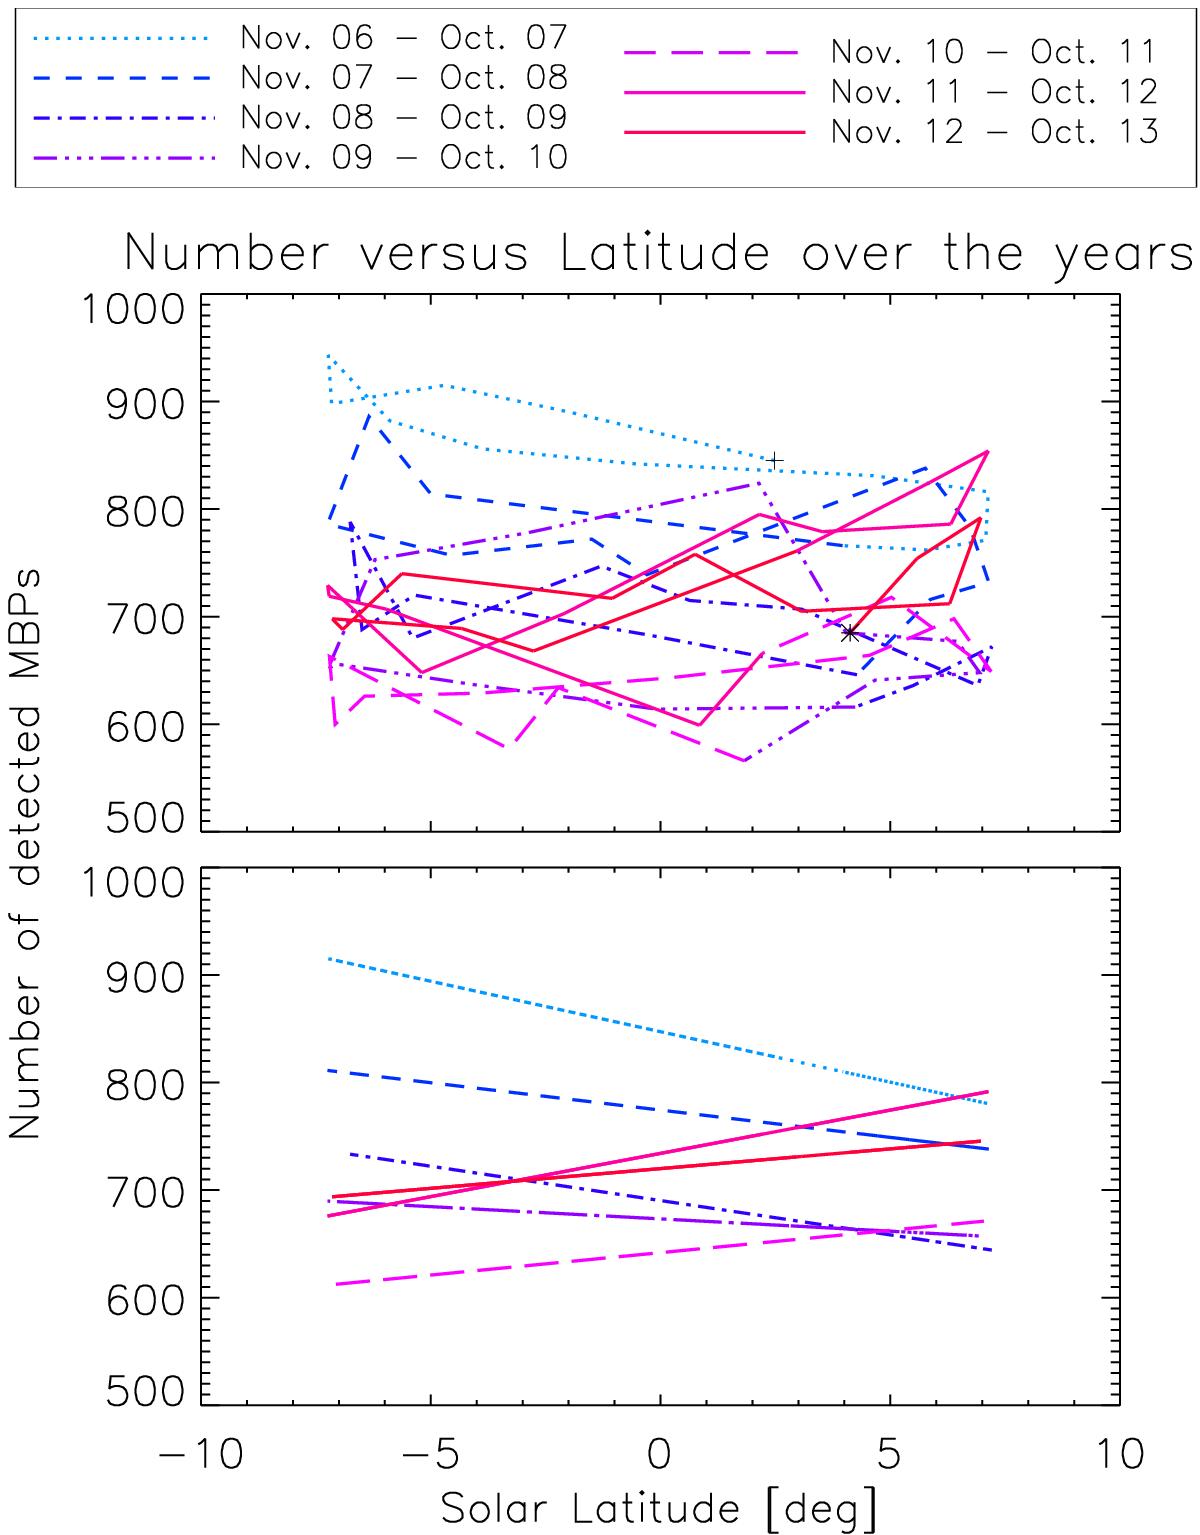
Monthly median number of MBPs detected over a FOV covering approximately ±5° in latitude versus solar latitude, plotted separately for yearly periods from November 2006 to October 2013. Top panel: starting point is marked by a cross while the last data point is depicted as a star. Each yearly period is shown in a different color and line style (according to the legend). Bottom panel: same as in the top panel but each yearly period is approximated by a linear trend line encoded in the same color and line style as in the top panel.
Current usage metrics show cumulative count of Article Views (full-text article views including HTML views, PDF and ePub downloads, according to the available data) and Abstracts Views on Vision4Press platform.
Data correspond to usage on the plateform after 2015. The current usage metrics is available 48-96 hours after online publication and is updated daily on week days.
Initial download of the metrics may take a while.