Fig. 3
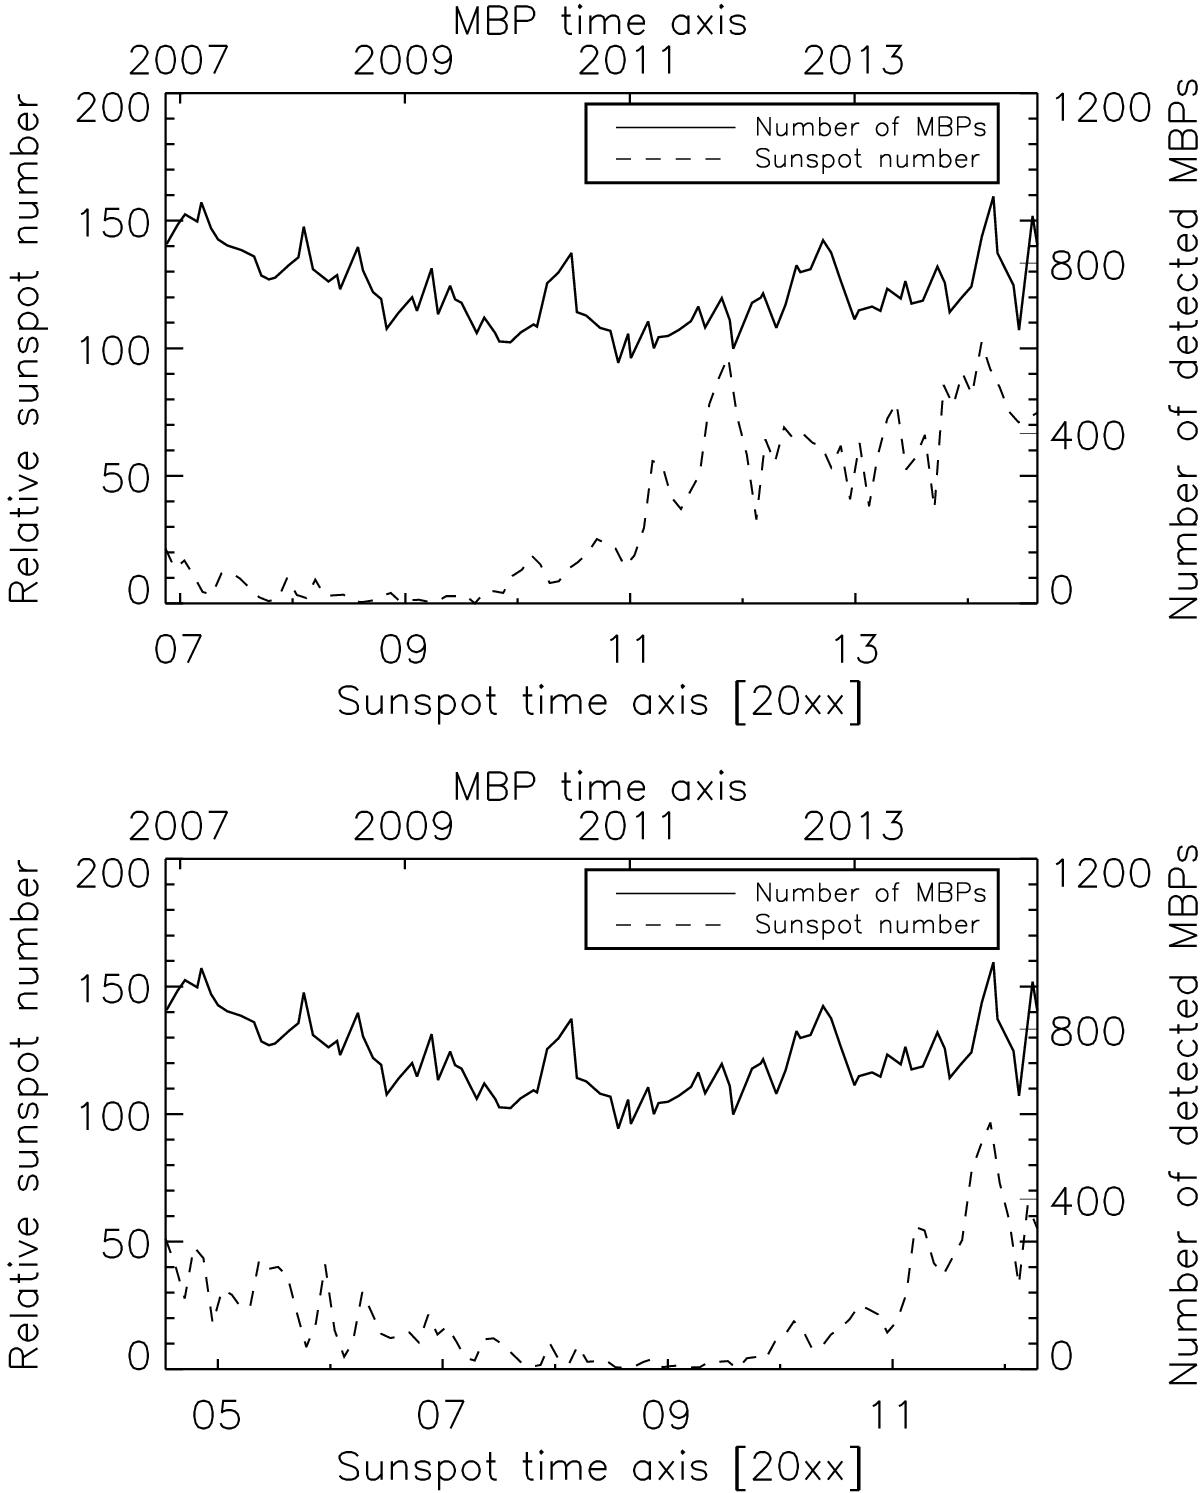
Top panel: monthly median number of detected MBPs after image selection via the contrast criterion versus time (solid line). The dashed line shows the relative sunspot number obtained from the Sunspot Index and Long-term Solar Observations Center. Bottom panel: as the top panel, but for the relative sunspot number shifted by 2.5 yr, yielding a cross-correlation coefficient of 0.56.
Current usage metrics show cumulative count of Article Views (full-text article views including HTML views, PDF and ePub downloads, according to the available data) and Abstracts Views on Vision4Press platform.
Data correspond to usage on the plateform after 2015. The current usage metrics is available 48-96 hours after online publication and is updated daily on week days.
Initial download of the metrics may take a while.