Free Access
Fig. 1
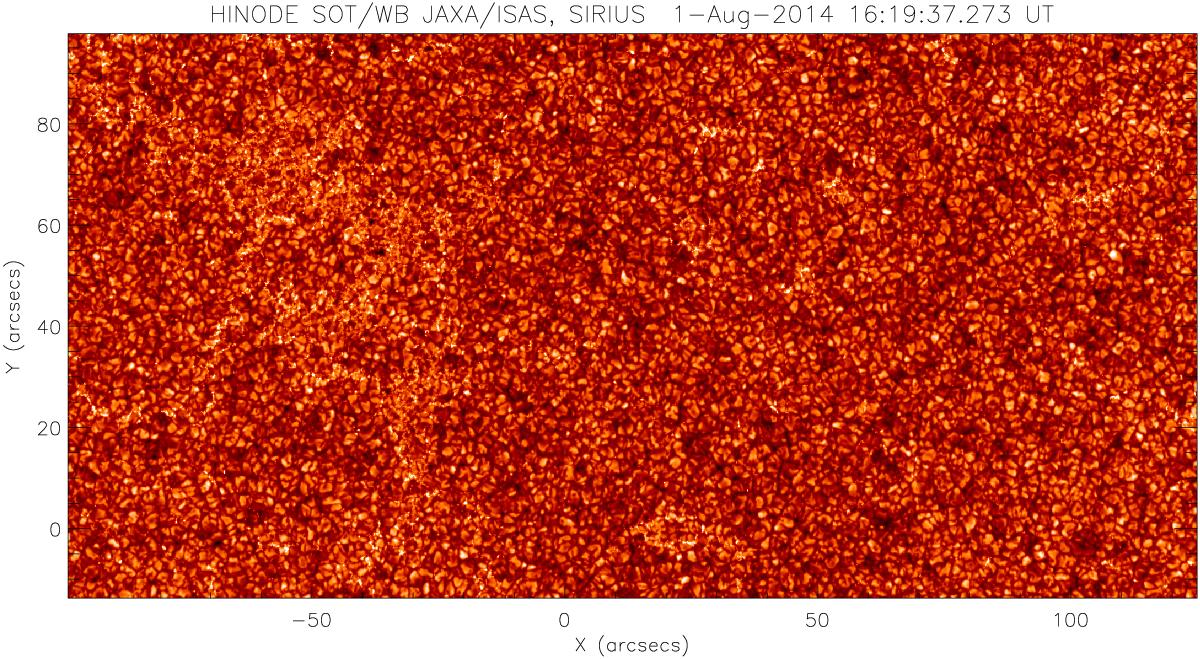
Synoptic Hinode/SOT G-band filtergram from 1 August 2014. To increase the contrast of the image, the data were clipped to be between 33% and 75% of the image’s intensity maximum.
Current usage metrics show cumulative count of Article Views (full-text article views including HTML views, PDF and ePub downloads, according to the available data) and Abstracts Views on Vision4Press platform.
Data correspond to usage on the plateform after 2015. The current usage metrics is available 48-96 hours after online publication and is updated daily on week days.
Initial download of the metrics may take a while.