Fig. 7
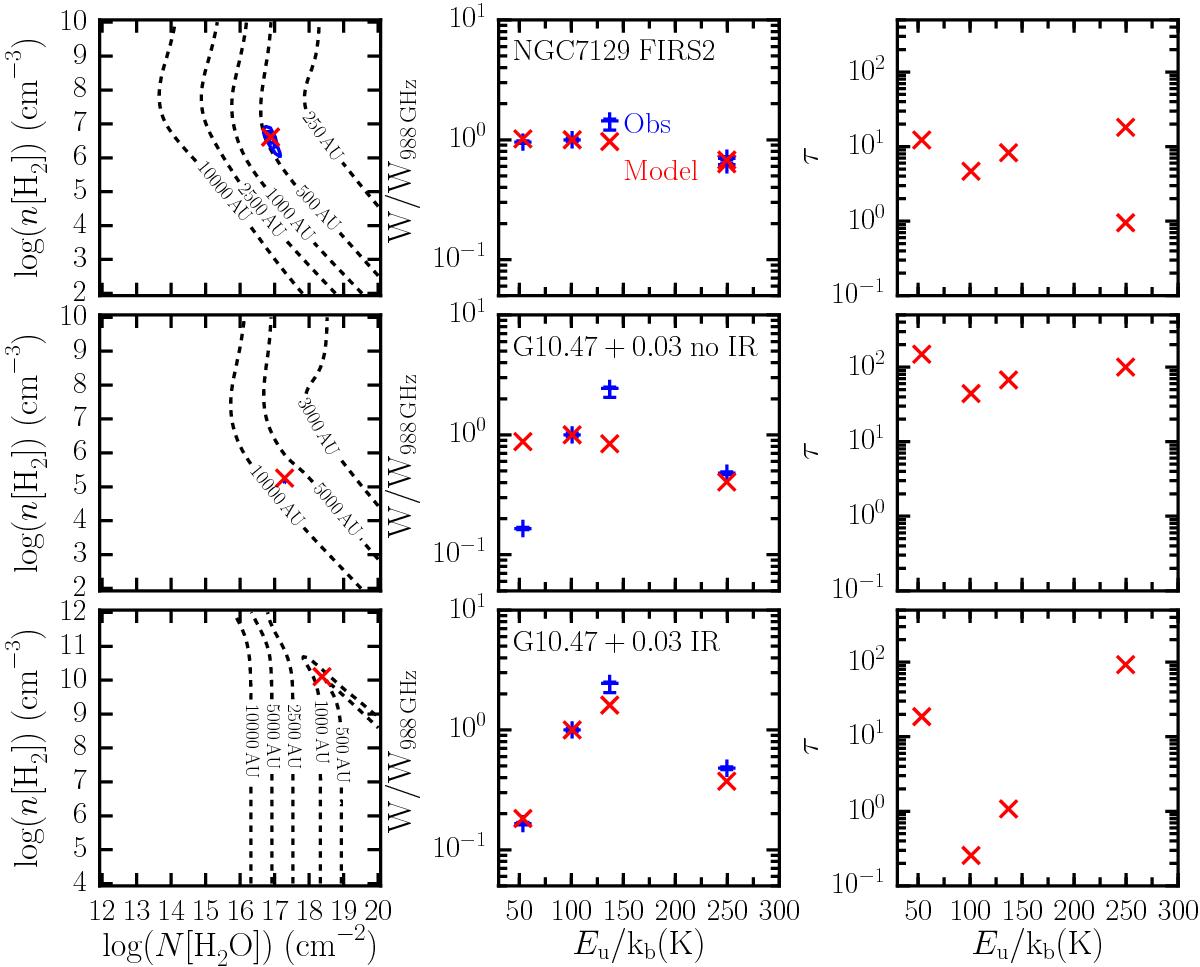
radex results for the average line ratios for the cavity shock components assuming a kinetic temperature of T = 300 K. The top panels corresponds to the intermediate-mass object NGC 7129 FIRS2 in which no infrared radiation field has been included. The middle and bottom panels show the results for the high-mass YSOs G10.47+0.03 without and with radiation field respectively. For each row, the left-hand panels show the best-fit (red cross), the 1, 3 and 5σ confidence limits (blue contours) for a grid in nH2 and NH2O and the corresponding size of the emitting region in AU (black dashed lines). The middle panels show a spectral line energy distribution comparing the observed and best-fit model with blue and red symbols respectively. Finally, the right-hand panels present the optical depth, τ, of the best-fit model for each H2O line.
Current usage metrics show cumulative count of Article Views (full-text article views including HTML views, PDF and ePub downloads, according to the available data) and Abstracts Views on Vision4Press platform.
Data correspond to usage on the plateform after 2015. The current usage metrics is available 48-96 hours after online publication and is updated daily on week days.
Initial download of the metrics may take a while.