Fig. 3
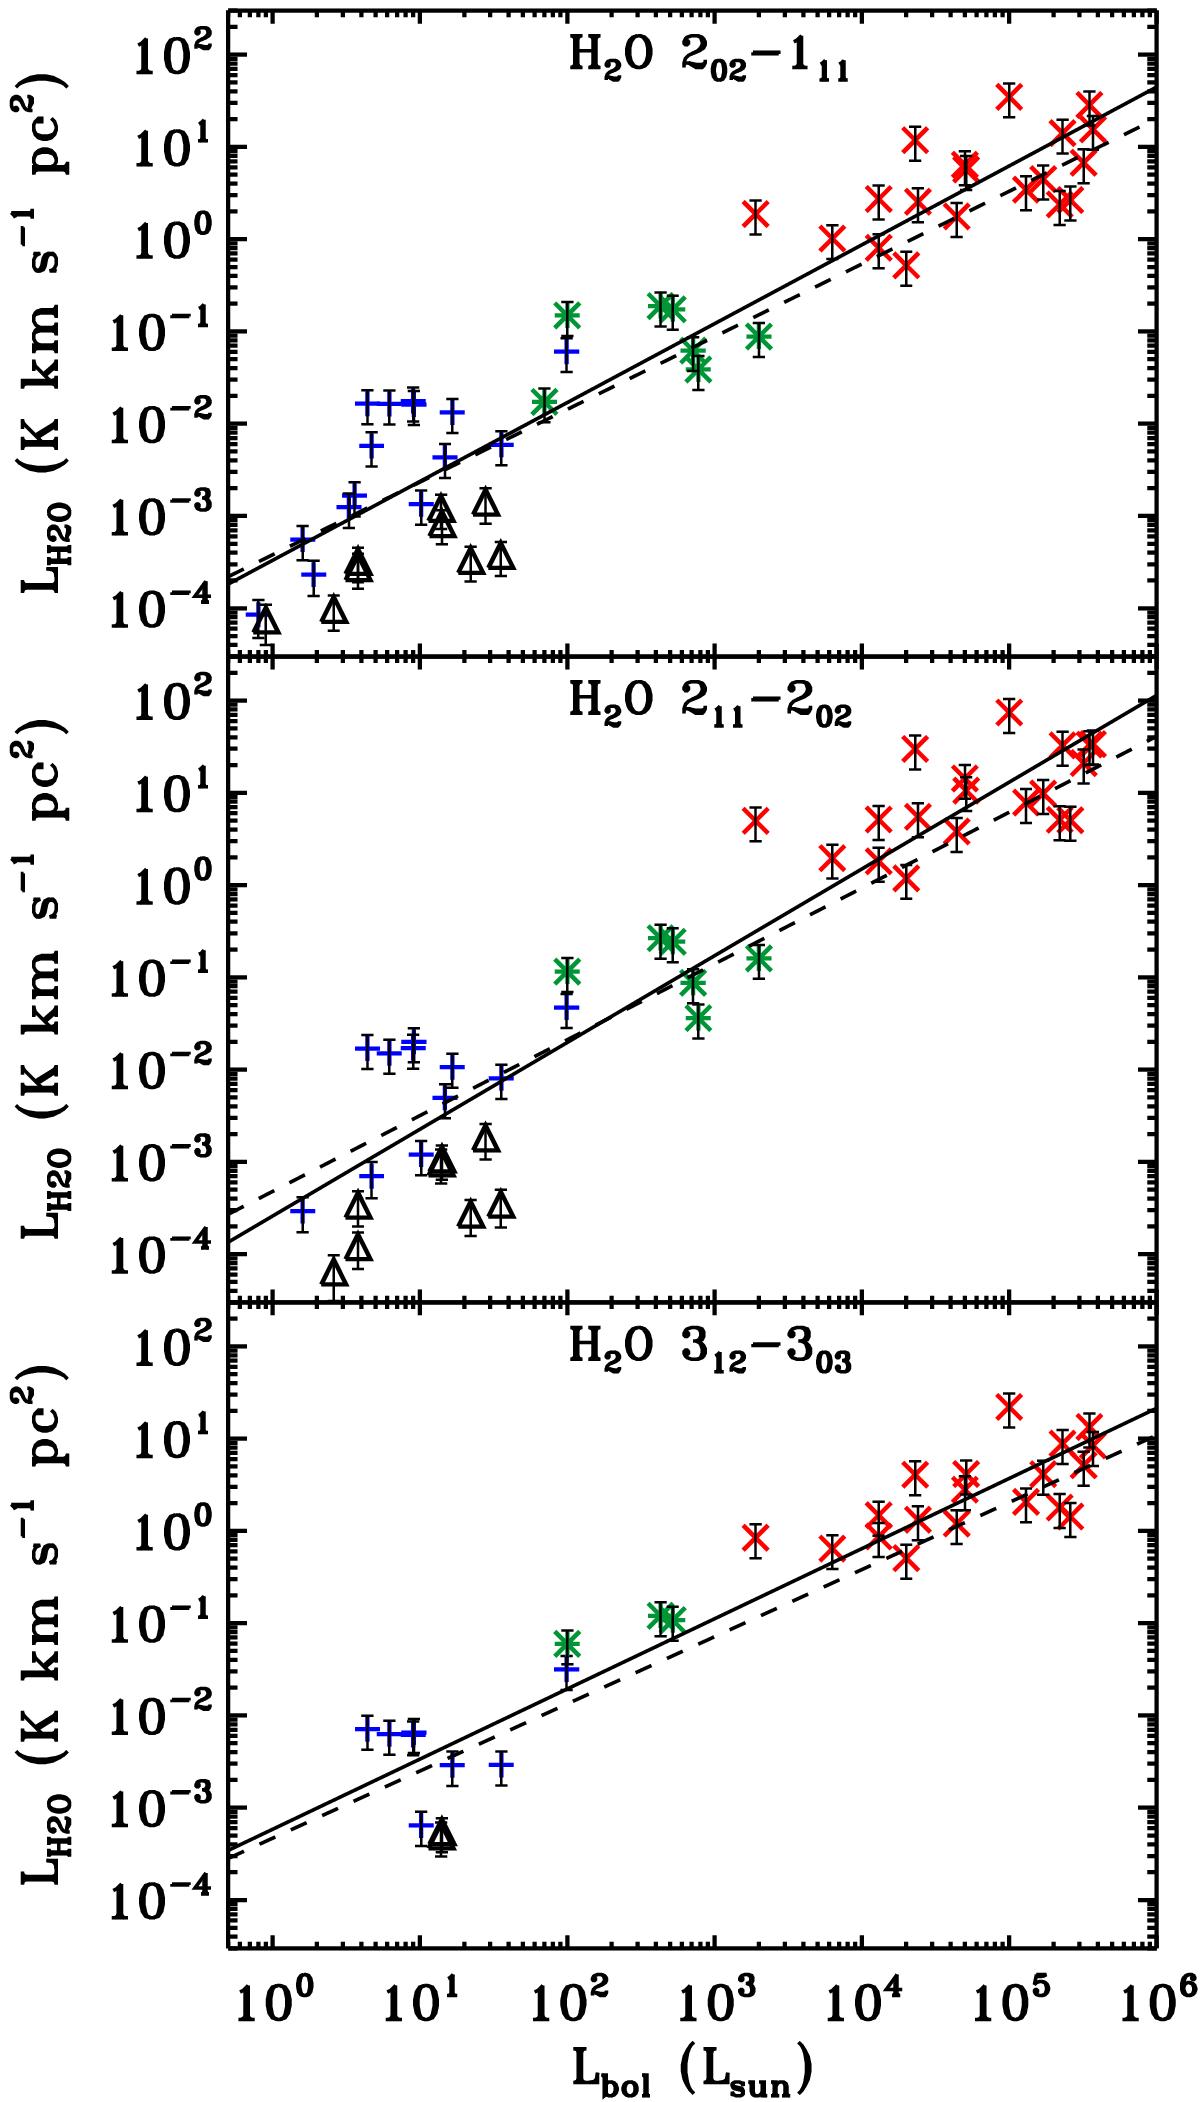
Line luminosity of the H2O 202–111 (988 GHz) line emission (top), the H2O 211–202 (752 GHz) data (middle), and H2O 312–303 (1097 GHz) spectra (bottom) versus the bolometric luminosity of the source. The blue plusses correspond to the low-mass Class 0 protostars, the black triangles the low-mass Class I, the green asterisks the intermediate-mass objects and the red cross symbols the high-mass YSOs. The solid line indicates the linear correlation of the logarithm of the total line luminosity, log(LH2O), and log(Lbol). The dashed line shows the log-log correlation of the luminosity measured for the broader Gaussian velocity component only (cavity shock emission; Lbroad H2O) and log(Lbol).
Current usage metrics show cumulative count of Article Views (full-text article views including HTML views, PDF and ePub downloads, according to the available data) and Abstracts Views on Vision4Press platform.
Data correspond to usage on the plateform after 2015. The current usage metrics is available 48-96 hours after online publication and is updated daily on week days.
Initial download of the metrics may take a while.