Fig. 2
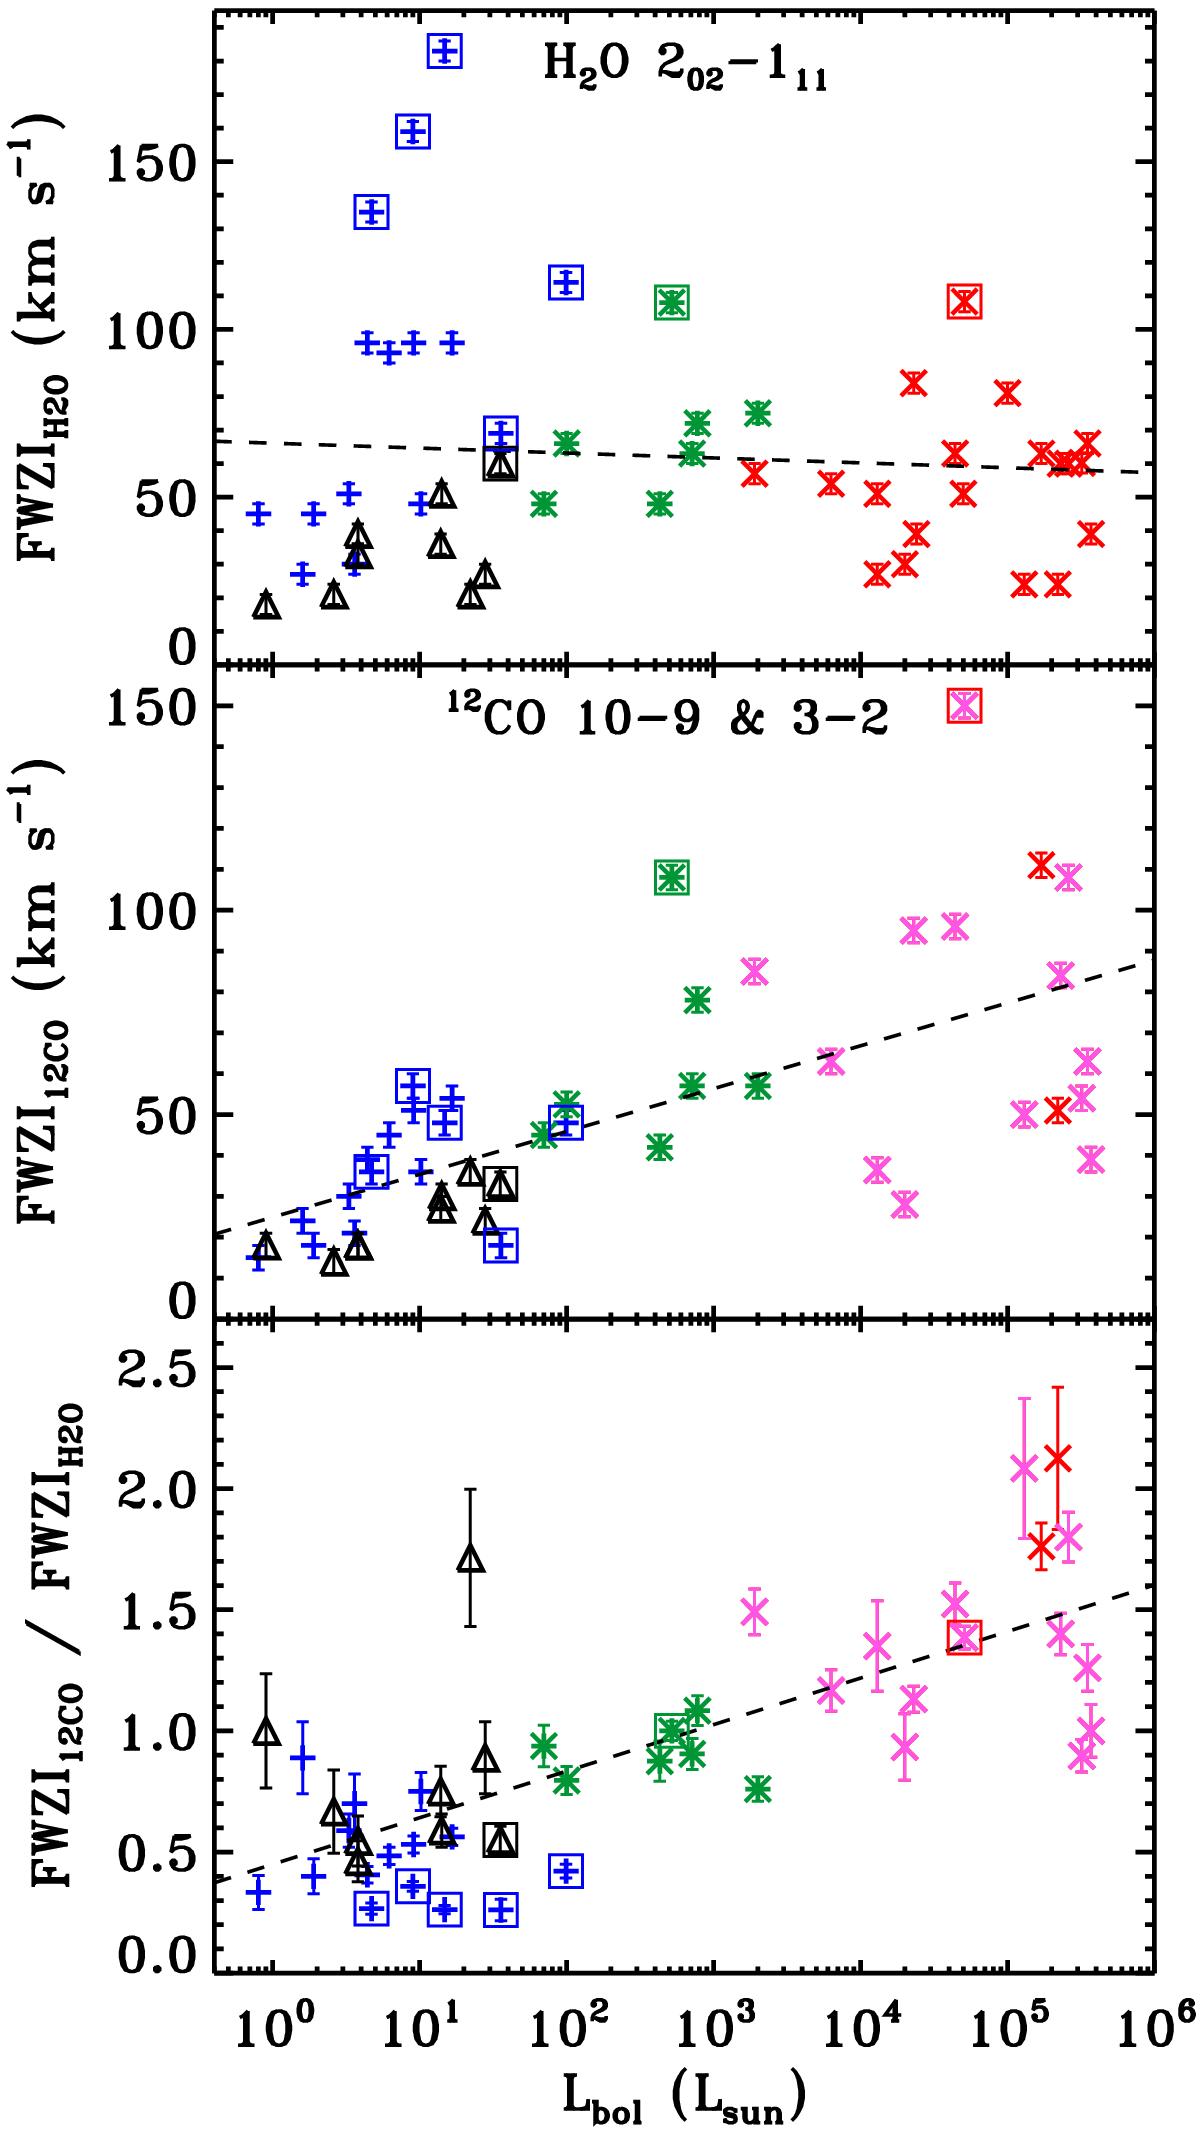
Top: FWZI of the H2O 202–111 (988 GHz) emission line versus the bolometric luminosity. Middle: same as top panel but for the 12CO J = 10–9 and J = 3–2 observations. Bottom: ratio of the 12CO and H2O 202–111 FWZI values as a function of Lbol. The blue plus symbols correspond to the low-mass Class 0 protostars, the black triangles the low-mass Class I, the green asterisks the intermediate-mass objects, the pink crosses the high-mass YSOs for which the 12CO J = 3–2 spectra are used, and the red cross symbols the high-mass object for which 12CO J = 10–9 data are available (see San José-García et al. 2013). The low- and intermediate-mass sources with detected EHV components are surrounded by a box, as well as the high-mass YSO with triangular water line profiles.
Current usage metrics show cumulative count of Article Views (full-text article views including HTML views, PDF and ePub downloads, according to the available data) and Abstracts Views on Vision4Press platform.
Data correspond to usage on the plateform after 2015. The current usage metrics is available 48-96 hours after online publication and is updated daily on week days.
Initial download of the metrics may take a while.