Fig. C.1
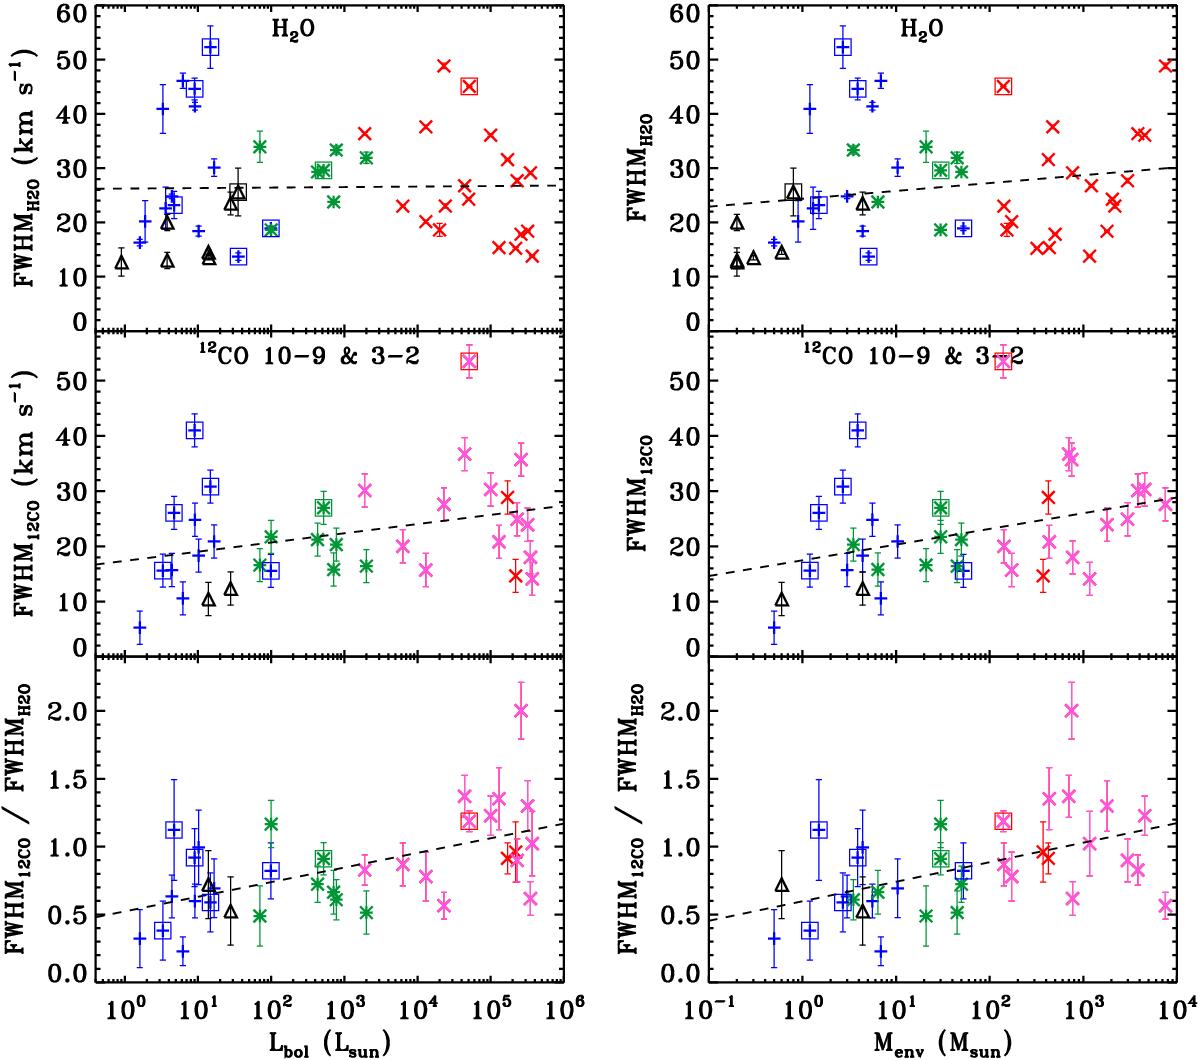
(Left-column figure) Derived FWHMb of the Gaussian profile fitted to the cavity shock component of the H2O lines (top-panel) as a function of bolometric luminosity. Constrained FWHMb for the 12CO J = 10–9 and J = 3–2 observations (middle-panel) versus Lbol. Ratio calculated from the 12CO FWHMb divided by the FWHMb of the H2O lines (bottom-panel) as a function of Lbol. (Right-column figure) Same as left- figure but plotted versus the envelope mass of the source, Menv. The blue plus symbols correspond to the low-mass Class 0 protostars, the black triangles the low-mass Class I, the green asterisks the intermediate-mass objects, the pink crosses the high-mass YSOs for which the 12CO J = 3–2 spectra are taken, and the red cross symbols the high-mass object for which 12CO J = 10–9 data are available (see San José-García et al. 2013). The low- and intermediate-mass objects with detected EHV components are surrounded by a box. Also the high-mass YSO with triangular water line profiles is surrounded by a box. The value of the FWHMb of the different velocity components is calculated as explained in Sect. 2.5 and these parameters are the same for the three water transitions.
Current usage metrics show cumulative count of Article Views (full-text article views including HTML views, PDF and ePub downloads, according to the available data) and Abstracts Views on Vision4Press platform.
Data correspond to usage on the plateform after 2015. The current usage metrics is available 48-96 hours after online publication and is updated daily on week days.
Initial download of the metrics may take a while.