Fig. 1
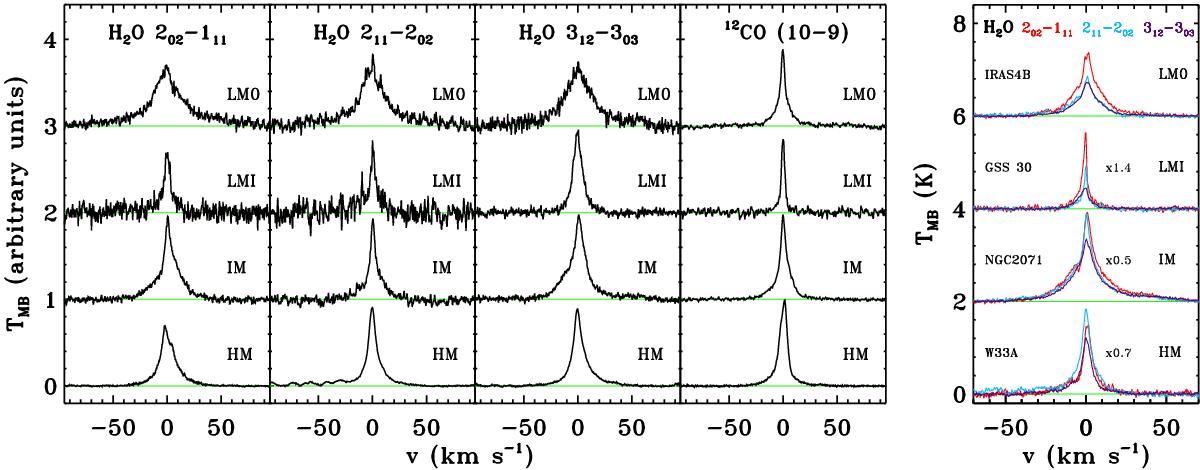
Left figure: averaged and normalised spectrum calculated for the low-mass Class 0 (LM0) protostars, the low-mass Class I (LMI), intermediate-mass YSOs (IM) and high-mass objects (HM) for the H2O 202–111 988 GHz (left panel), 211–202 752 GHz (middle-left panel), 312–303 1097 GHz (middle-right panel) transitions and the 12CO J = 10–9 (right panel) spectra (see San José-García et al. 2013). The spectra of each sub-group of YSOs have been shifted vertically for visualisation purposes. The low intensity features on the blue wing of the H2O 211–202 high-mass profile are due to methanol emission. Right figure: H2O 202–111, 211–202 and 312–303 spectra plotted in red, blue and purple respectively for NGC 1333 IRAS4B (LM0), GSS 30 (LMI), NGC 2071 (IM) and W33A (HM). The horizontal light green lines in both figures represent the baseline level.
Current usage metrics show cumulative count of Article Views (full-text article views including HTML views, PDF and ePub downloads, according to the available data) and Abstracts Views on Vision4Press platform.
Data correspond to usage on the plateform after 2015. The current usage metrics is available 48-96 hours after online publication and is updated daily on week days.
Initial download of the metrics may take a while.