Fig. 8
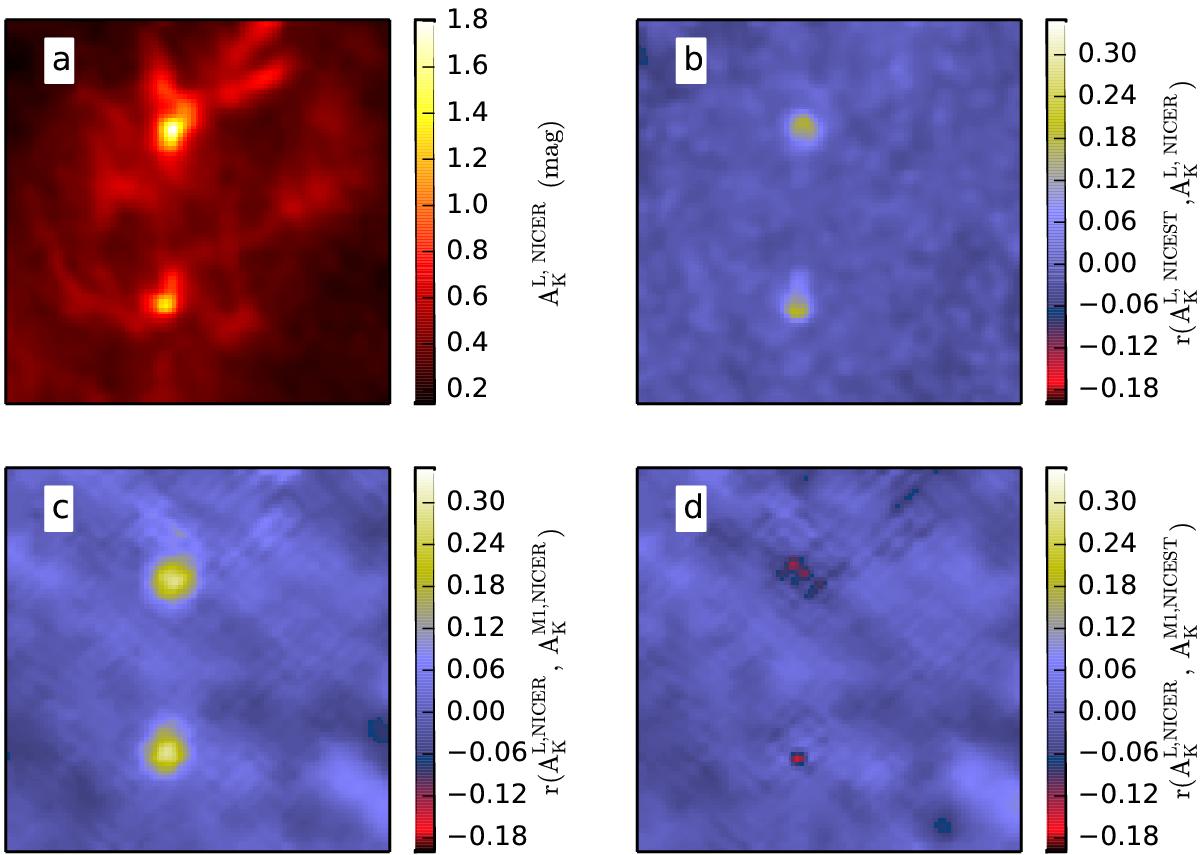
A detail of the Pipe extinction maps. Frame a) shows the 1′ resolution NICER reference map (Lombardi et al. 2006) convolved to 3′ resolution. The other frames show relative differences between: Lombardi et al. NICEST and NICER maps (frame b); both convolved from 1′ to 3′), M1-NICER with the original resolution of 3′ and Lombardi et al. NICER convolved to the same resolution (frame c)), and M1-NICEST with the original resolution of 3′ and Lombardi et al. NICER convolved to the same resolution (frame d)).
Current usage metrics show cumulative count of Article Views (full-text article views including HTML views, PDF and ePub downloads, according to the available data) and Abstracts Views on Vision4Press platform.
Data correspond to usage on the plateform after 2015. The current usage metrics is available 48-96 hours after online publication and is updated daily on week days.
Initial download of the metrics may take a while.