Fig. 3
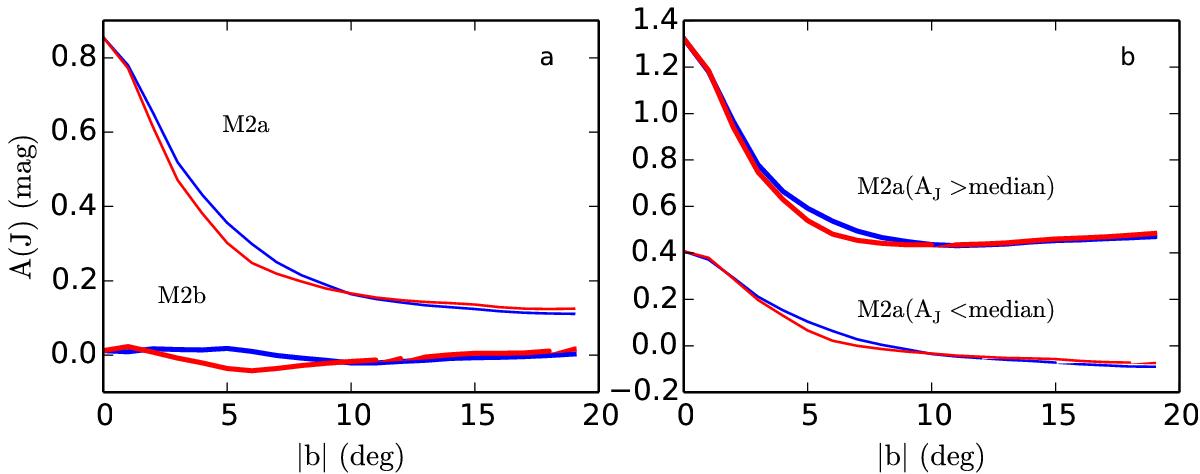
Comparison of median NICER AJ profiles as function of Galactic latitude. Frame a) compares M2a (thin lines) and M2b maps (thick lines) for the profiles at positive (blue lines) and negative (red lines) Galactic latitudes. Frame b) shows comparison of M2a maps constructed using those stars that have values below (thin lines) or above (thick lines) the median AJ of all stars within the smoothing kernel.
Current usage metrics show cumulative count of Article Views (full-text article views including HTML views, PDF and ePub downloads, according to the available data) and Abstracts Views on Vision4Press platform.
Data correspond to usage on the plateform after 2015. The current usage metrics is available 48-96 hours after online publication and is updated daily on week days.
Initial download of the metrics may take a while.