Fig. 1
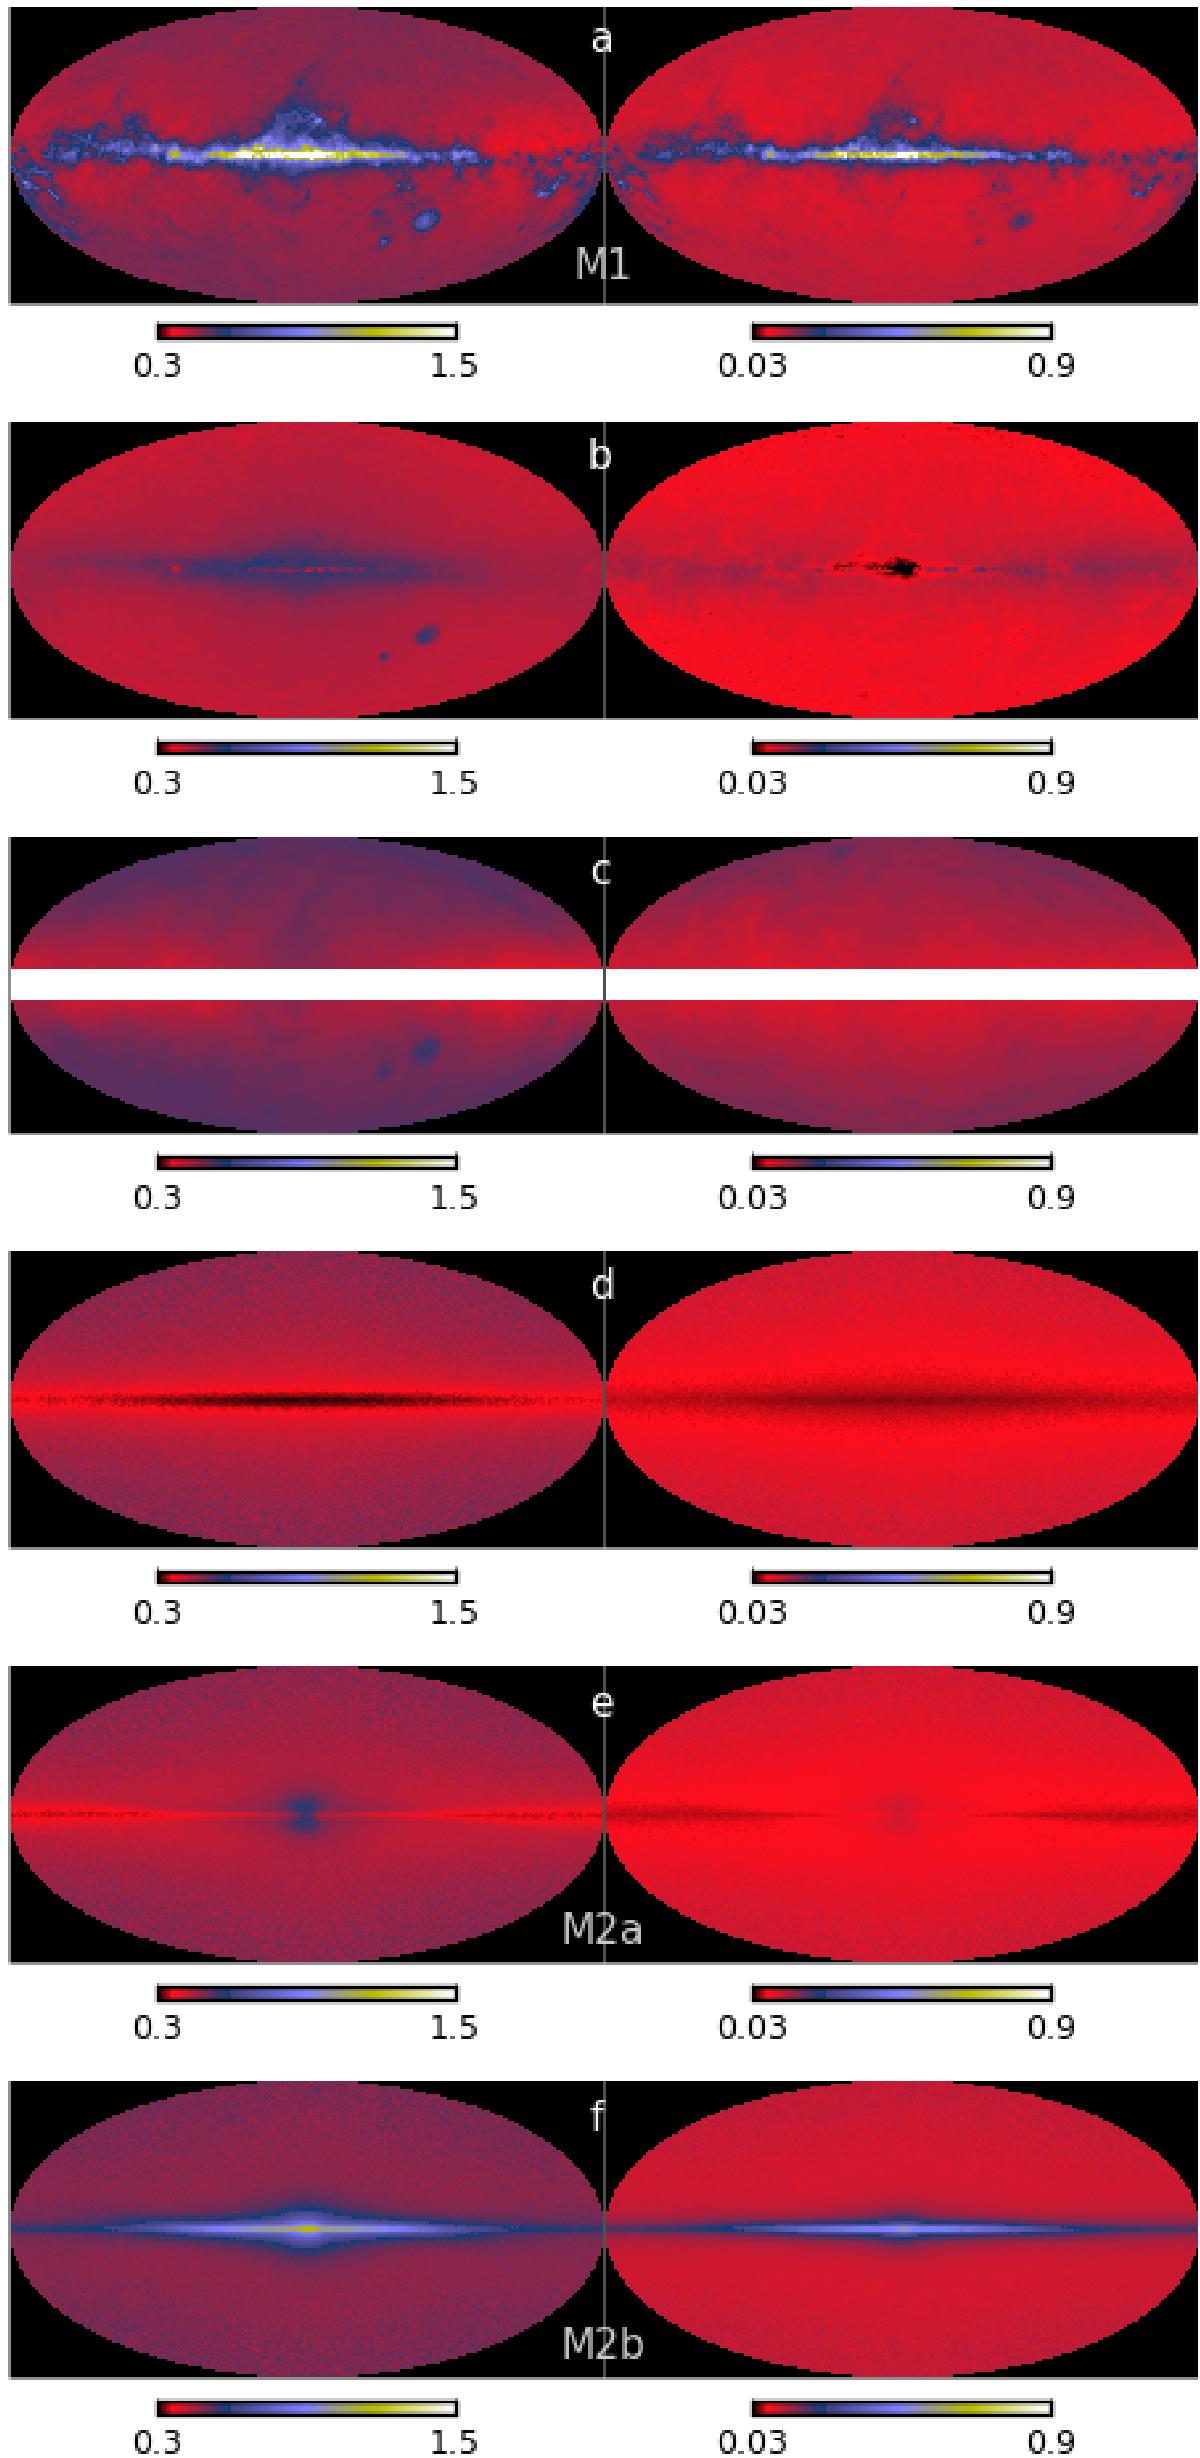
Six versions of all-sky maps of the average J − H (left frames) and H − K (right frames) colours. The first three are based on observed 2MASS sources (frames a)−c)) and the last three (frames d), f)) on stars simulated with the Besançon model. See text for details. The labels M1, M2a, and M2b refer to extinction maps where the corresponding data are used as reference colours.
Current usage metrics show cumulative count of Article Views (full-text article views including HTML views, PDF and ePub downloads, according to the available data) and Abstracts Views on Vision4Press platform.
Data correspond to usage on the plateform after 2015. The current usage metrics is available 48-96 hours after online publication and is updated daily on week days.
Initial download of the metrics may take a while.