Free Access
Fig. 4
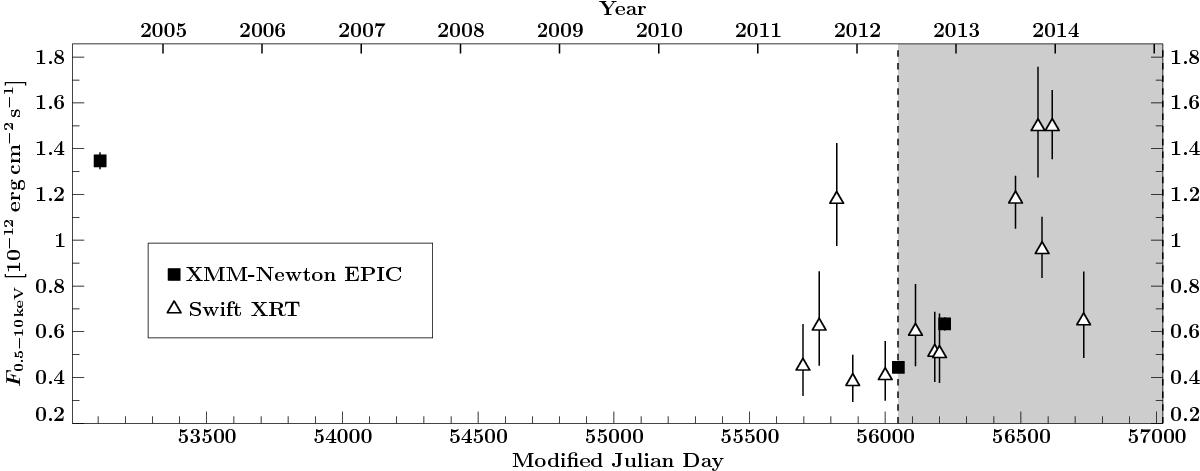
Long-term behavior of the total absorption-corrected 0.5–10 keV flux. The gray-shaded background denotes the multiwavelength monitoring period. XMM-Newton data are shown as black squares, Swift data are plotted as triangles.
Current usage metrics show cumulative count of Article Views (full-text article views including HTML views, PDF and ePub downloads, according to the available data) and Abstracts Views on Vision4Press platform.
Data correspond to usage on the plateform after 2015. The current usage metrics is available 48-96 hours after online publication and is updated daily on week days.
Initial download of the metrics may take a while.