Fig. 2
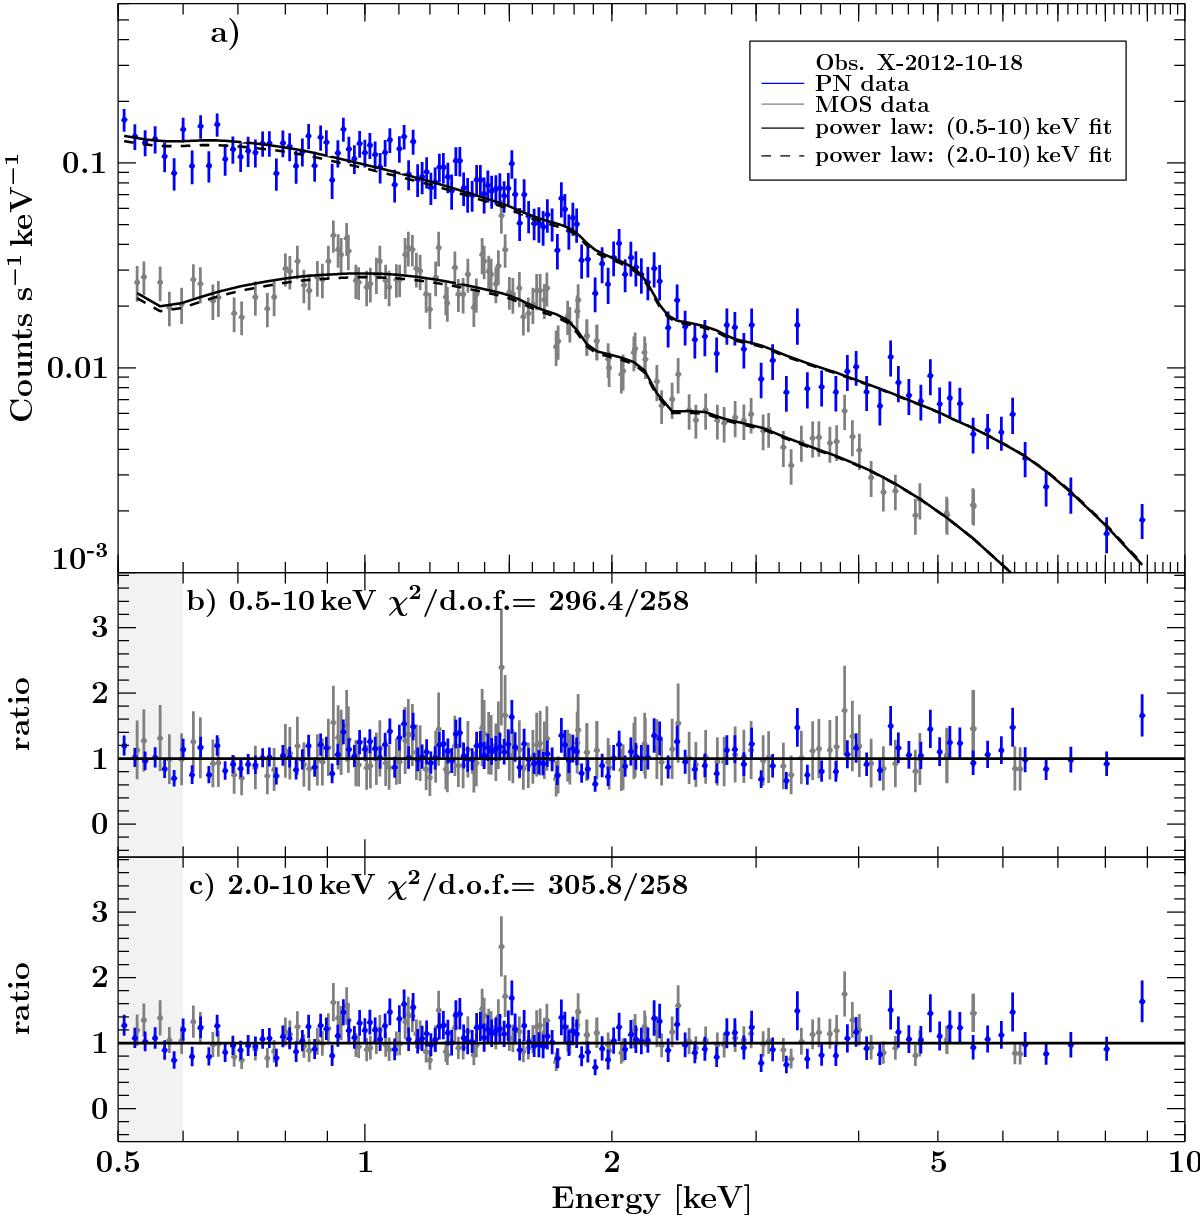
XMM-Newton spectrum and best-fit results of X-2012-10-18. Upper panel a) EPIC pn (blue) and MOS (gray) data, as well as corresponding best fits for an absorbed power law evaluated over (0.5–10) keV (black solid line) and (2–10) keV (black dashed line). Mid panel b) Data-to-model ratio for the best fit over the whole (0.5–10) keV energy range. Lower panel c) Respective residuals for fitting the (2–10) keV energy range alone, extrapolated to lower energies. A tentative soft excess below 0.6 keV is only observed for X-2004-04-11 (compare shaded regions).
Current usage metrics show cumulative count of Article Views (full-text article views including HTML views, PDF and ePub downloads, according to the available data) and Abstracts Views on Vision4Press platform.
Data correspond to usage on the plateform after 2015. The current usage metrics is available 48-96 hours after online publication and is updated daily on week days.
Initial download of the metrics may take a while.