Fig. 8
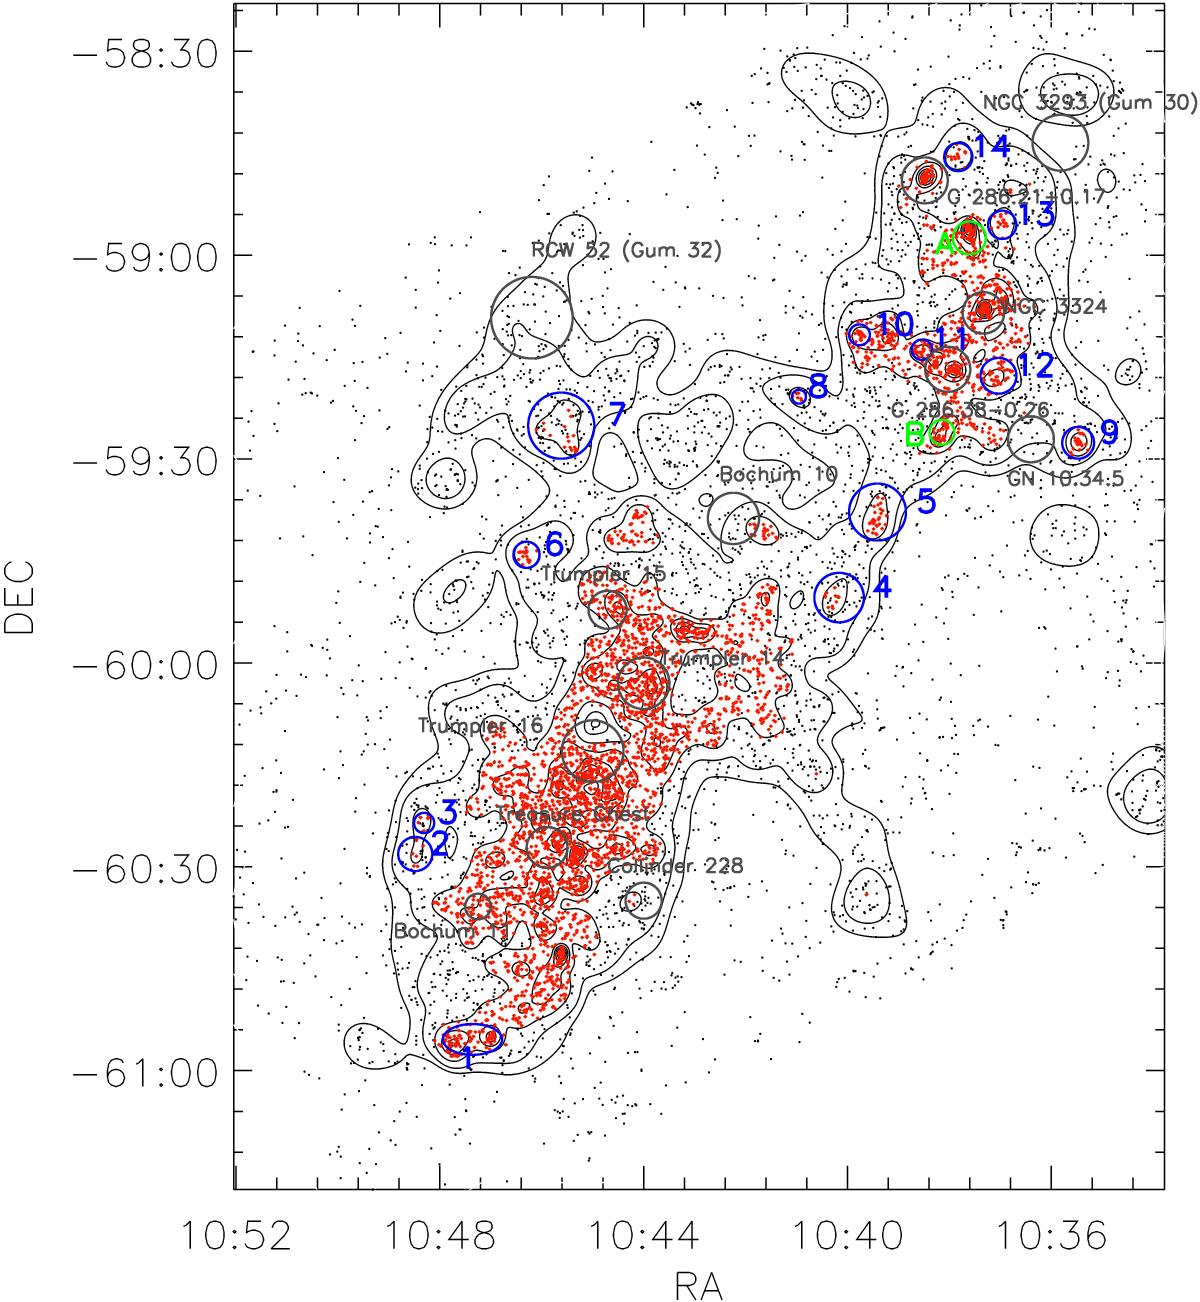
Map of all infrared-excess-selected sources. The red dots represent all sources for which the density is higher than the cut-off density (4000 deg-2). The black circles mark the previously known clusters, while blue circles represent the newly identified clusters. The derived details about these clusters, as well as their coordinates, are listed in Table 2.
Current usage metrics show cumulative count of Article Views (full-text article views including HTML views, PDF and ePub downloads, according to the available data) and Abstracts Views on Vision4Press platform.
Data correspond to usage on the plateform after 2015. The current usage metrics is available 48-96 hours after online publication and is updated daily on week days.
Initial download of the metrics may take a while.