Free Access
Fig. 7
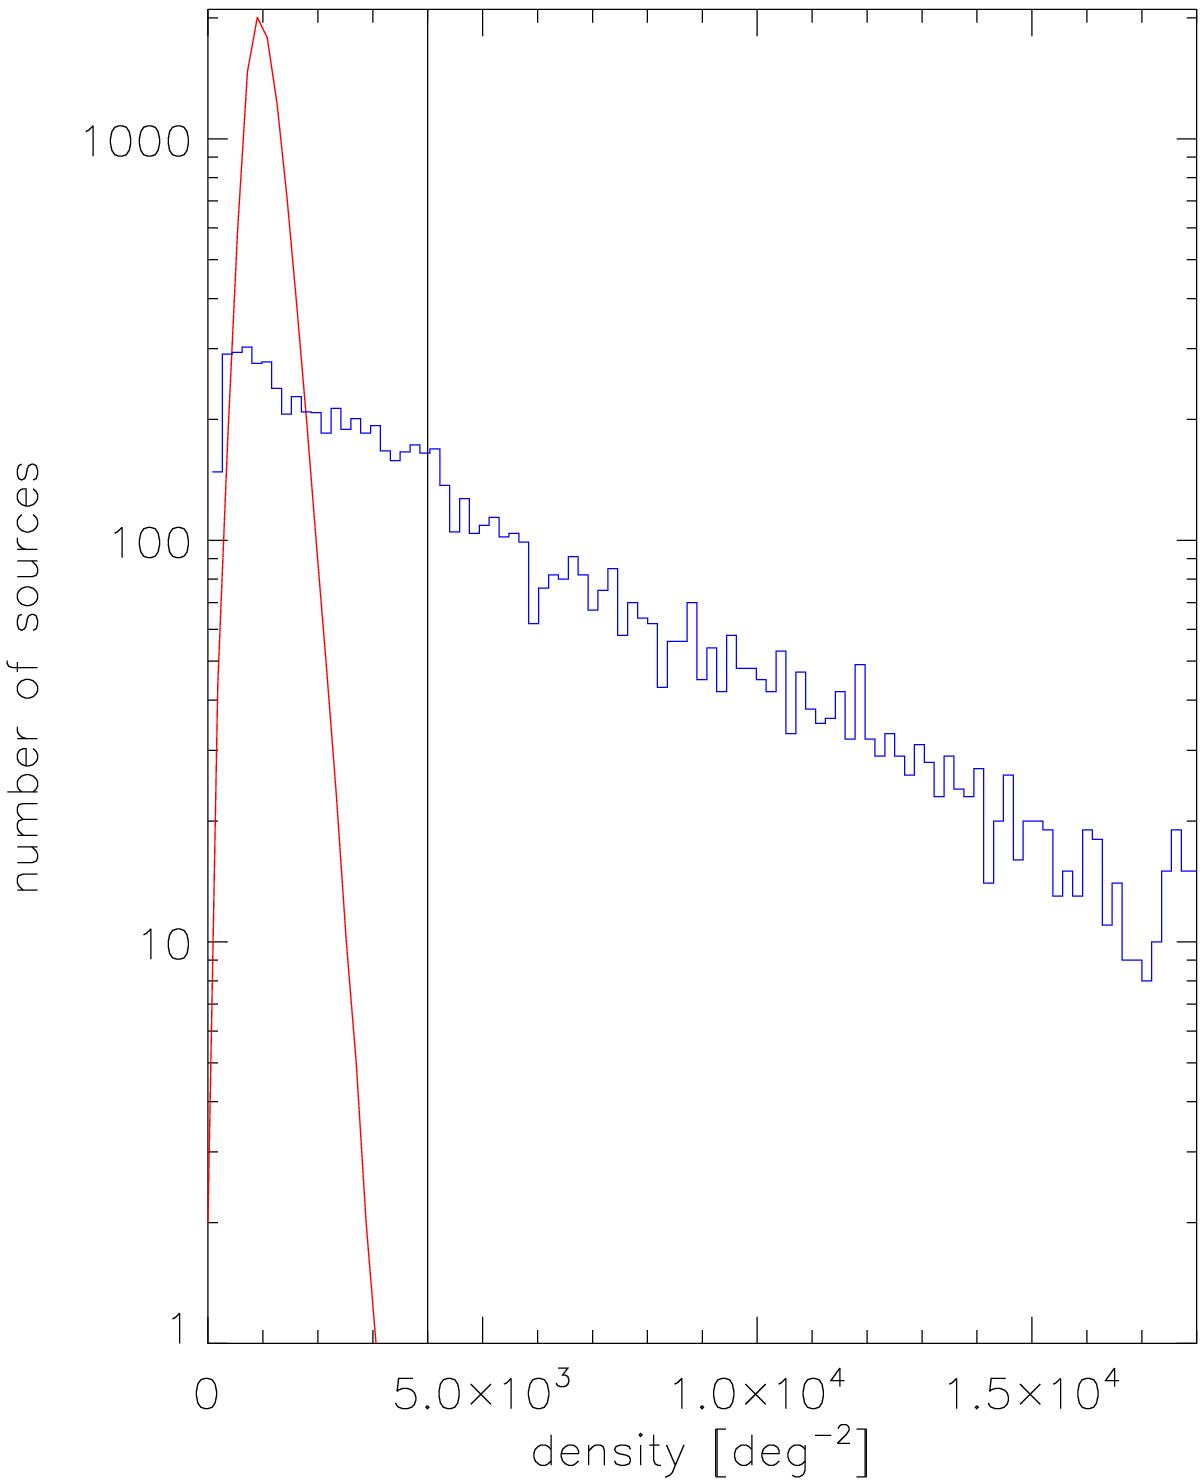
Histogram of the nearest-neighbor analysis surface densities for the infrared-excess-selected sources. The red curve visualizes the surface density of the same number of randomly distributed stars. The vertical line indicates our cut-off limit for clusters at 4000 deg-2.
Current usage metrics show cumulative count of Article Views (full-text article views including HTML views, PDF and ePub downloads, according to the available data) and Abstracts Views on Vision4Press platform.
Data correspond to usage on the plateform after 2015. The current usage metrics is available 48-96 hours after online publication and is updated daily on week days.
Initial download of the metrics may take a while.