Fig. 5
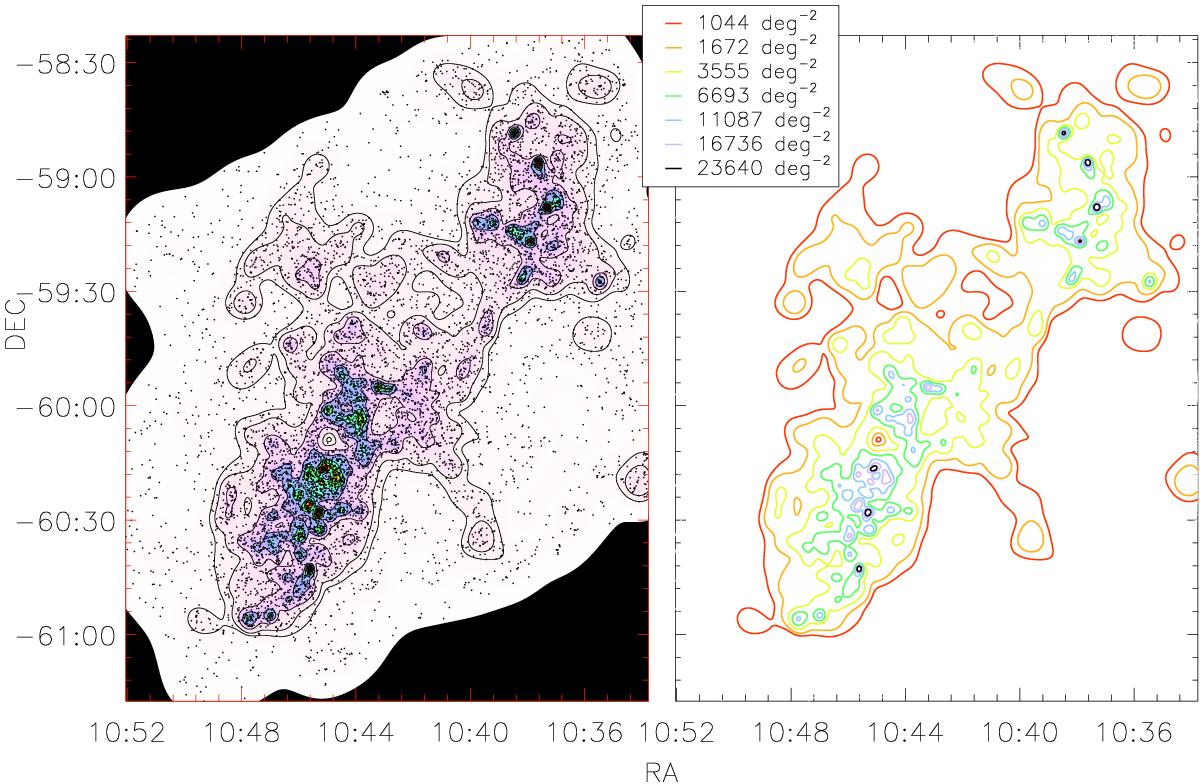
Left: surface density of the infrared-excess-selected cYSOs resulting from the nearest neighbor analysis. The black dots represent the individual 8781 cYSOs. The locations of the main clusters like Tr 14, Tr 15, Tr 16, and NGC 3324 are easily visible. The black solid area is not covered by both surveys and therefore the density drops down to zero. The curvy border is a result of the contour smoothing. Right: contour representation of the surface density of the infrared-excess-selected cYSOs. The contours show surface density values from μmin = 1044 deg-2 (red) to μmax = 23 640 deg-2 (black), with the levels μk = (k/ 6)2·(μmax−μmin) + μmin, with k = [0,6].
Current usage metrics show cumulative count of Article Views (full-text article views including HTML views, PDF and ePub downloads, according to the available data) and Abstracts Views on Vision4Press platform.
Data correspond to usage on the plateform after 2015. The current usage metrics is available 48-96 hours after online publication and is updated daily on week days.
Initial download of the metrics may take a while.