Fig. 4
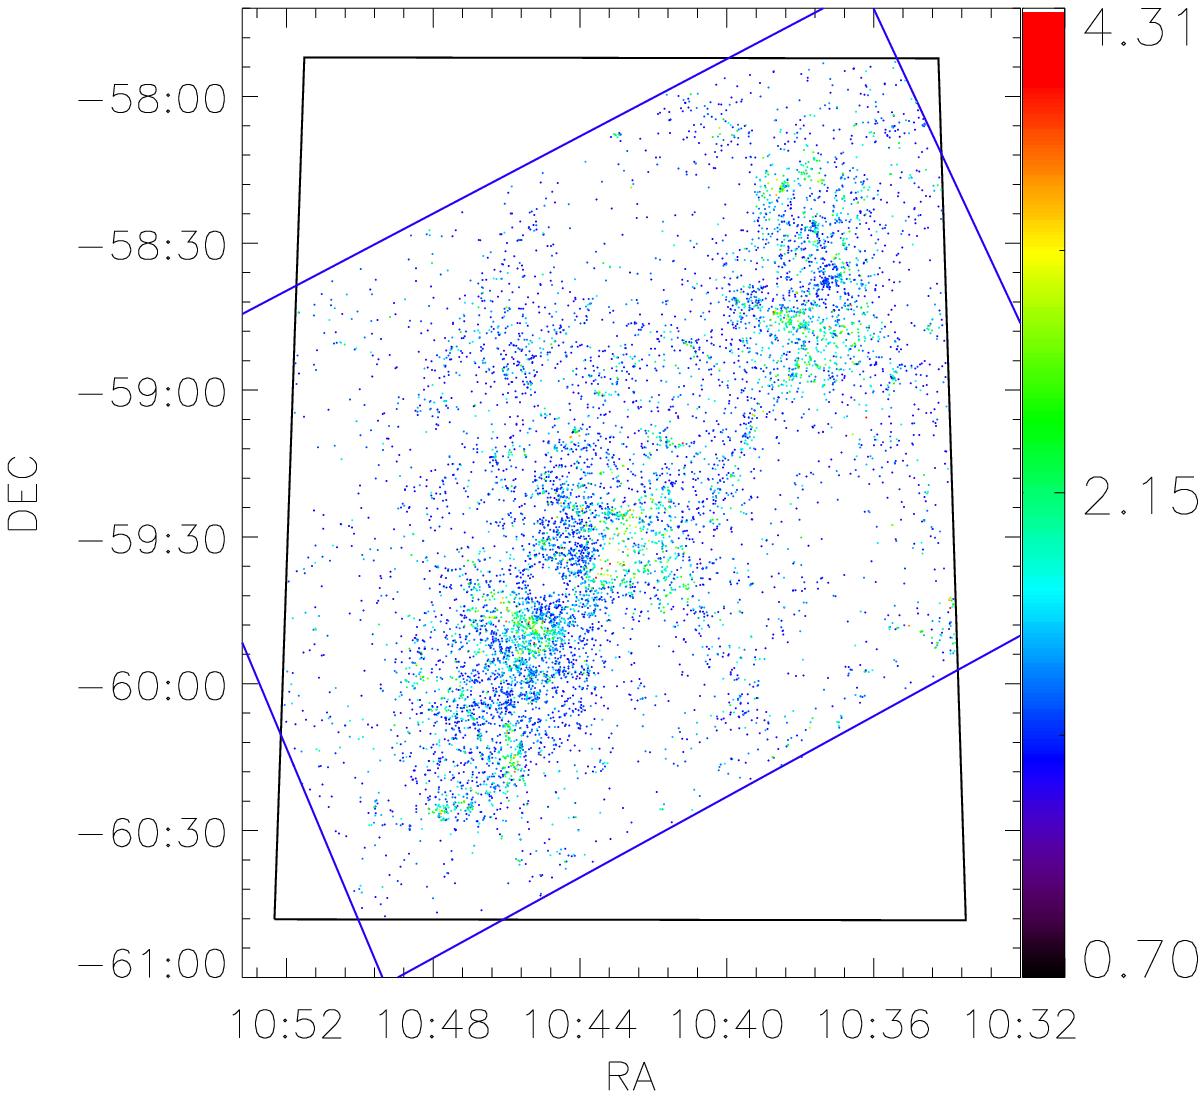
Spatial distribution of the 8781 selected infrared excess sources. The color of the individual point shows the (J−H) color of each object. The white hole in the central region with a single spot in the center marks the region around η Car, where the catalogs list no sources due to very strong saturation effects in the Spitzer and VISTA images. The black box represents the VCNS area, the blue box the Spitzer survey area.
Current usage metrics show cumulative count of Article Views (full-text article views including HTML views, PDF and ePub downloads, according to the available data) and Abstracts Views on Vision4Press platform.
Data correspond to usage on the plateform after 2015. The current usage metrics is available 48-96 hours after online publication and is updated daily on week days.
Initial download of the metrics may take a while.