Fig. 3
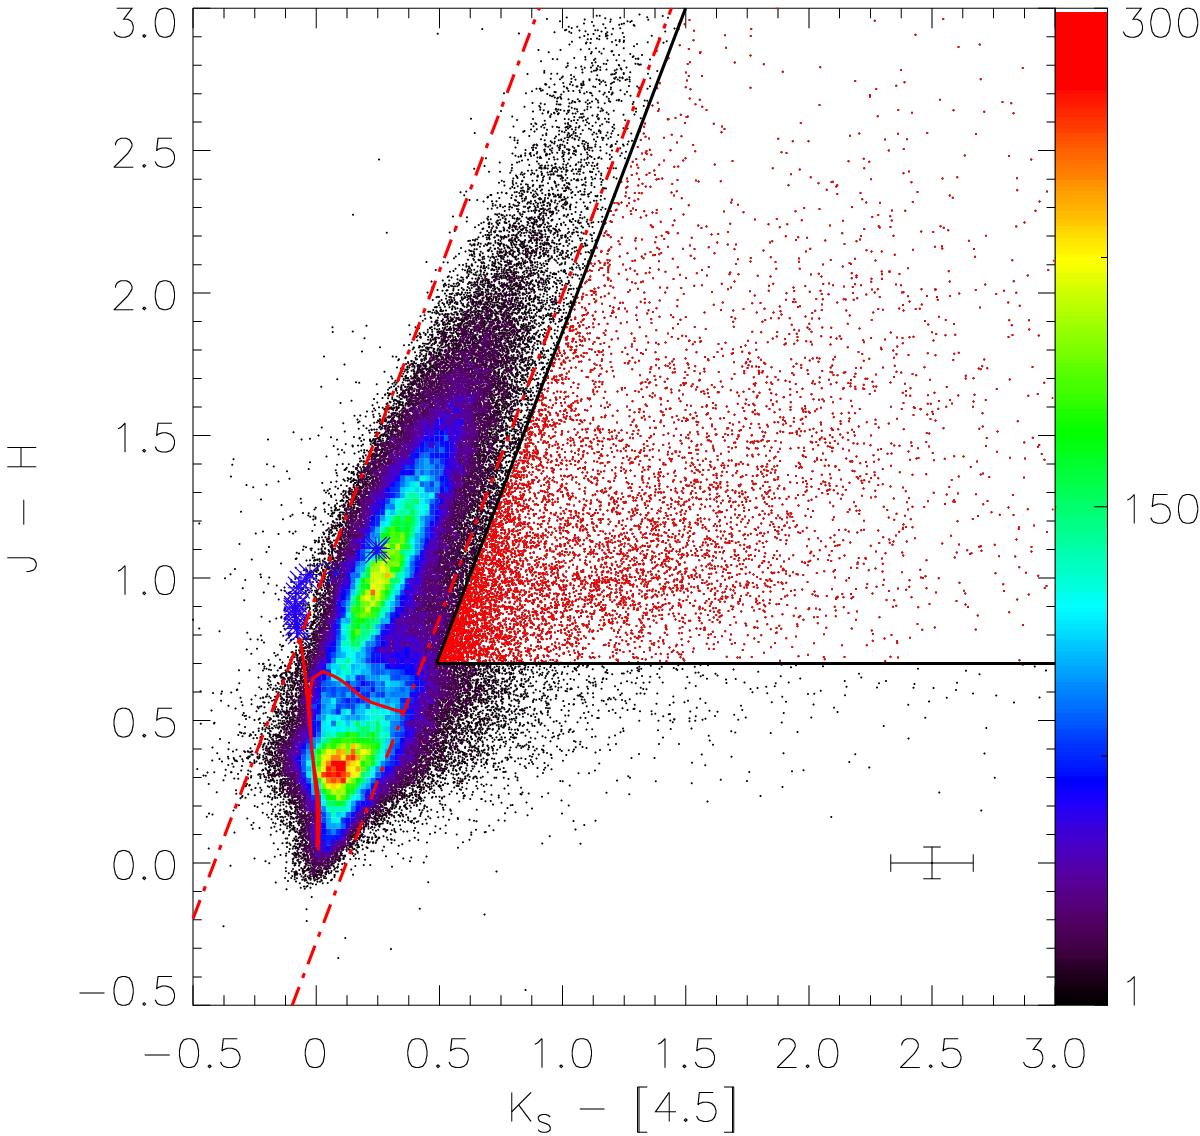
(J−H) vs. (Ks− [4.5]) CCD of the 181 854 sources with S/N> 10 in all four filter bands. The dashed-dotted red lines show the reddening band for main sequence colors, based on a slope of 2.27 for the extinction vector. The solid red line shows the main sequence stars from the Padova stellar models (Bressan et al. 2012) and the blue asterisks show the locus of the red supergiants, TP-AGBs, and upper-RGBs produced with the dusty models. We also give the typical uncertainties of the photometry from Preibisch et al. (2014) for the VISTA data and from Ohlendorf et al. (2013) for the [4.5]-band. The color bar shows the number of objects per bin (bin size = 0.02 mag × 0.02 mag). The black lines mark the color limits for the infrared excess selection: (Ks− [4.5] > 0.49) and (J−H) < [(Ks− [4.5] )−0.49] ·2.27 + 0.7. In total 8781 objects are classified as infrared excess sources shown by red dots.
Current usage metrics show cumulative count of Article Views (full-text article views including HTML views, PDF and ePub downloads, according to the available data) and Abstracts Views on Vision4Press platform.
Data correspond to usage on the plateform after 2015. The current usage metrics is available 48-96 hours after online publication and is updated daily on week days.
Initial download of the metrics may take a while.