Fig. 1
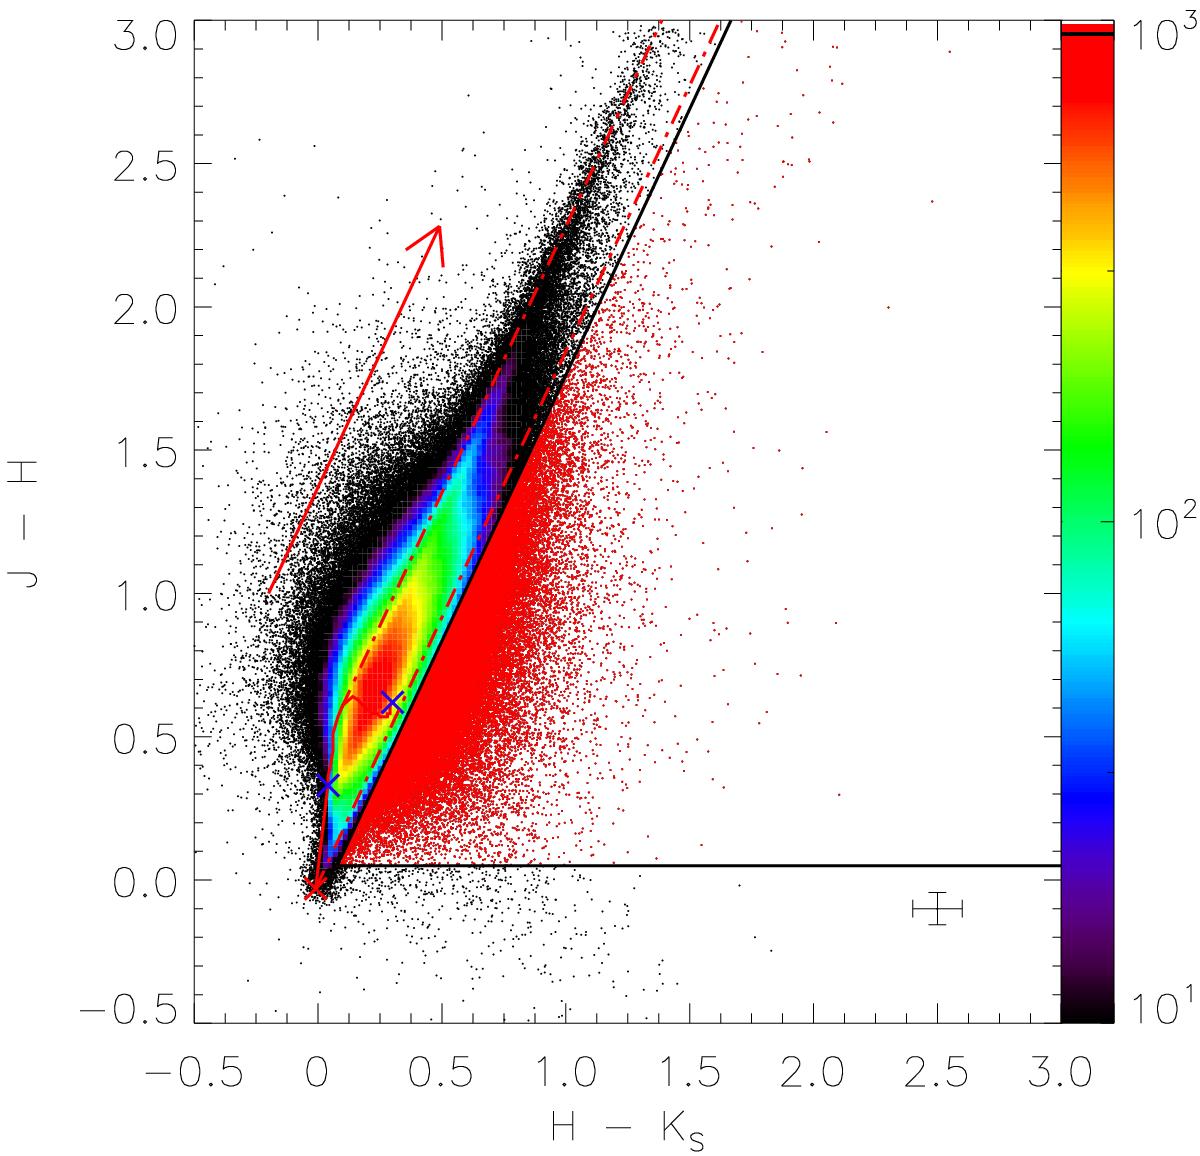
Hess diagram of the (J−H) vs. (H−Ks) color–color diagram. The color indicates the number of objects in each bin with a size of 0.02 mag × 0.02 mag. A logarithmic scale has been used. The red arrow represents the reddening vector for AV = 10 mag based on a slope of 1.86. The solid red line shows the expected colors of main sequence stars according to the model of Baraffe et al. (1998). The blue crosses correspond to 1.0 M⊙ and 0.1 M⊙ stars, the red cross indicates the position of A0 stars. The dashed-dotted red lines show the reddening band for main sequence stars. The black lines represent the infrared excess selection with J−H> 0.05 mag, H−Ks> 0.05 mag, and 0.05 mag below and to the right of the reddening band of the main sequence. We also provide the typical uncertainties of the photometry derived in Preibisch et al. (2014). In total 86 175 objects are classified as NIR excess sources shown by red dots.
Current usage metrics show cumulative count of Article Views (full-text article views including HTML views, PDF and ePub downloads, according to the available data) and Abstracts Views on Vision4Press platform.
Data correspond to usage on the plateform after 2015. The current usage metrics is available 48-96 hours after online publication and is updated daily on week days.
Initial download of the metrics may take a while.