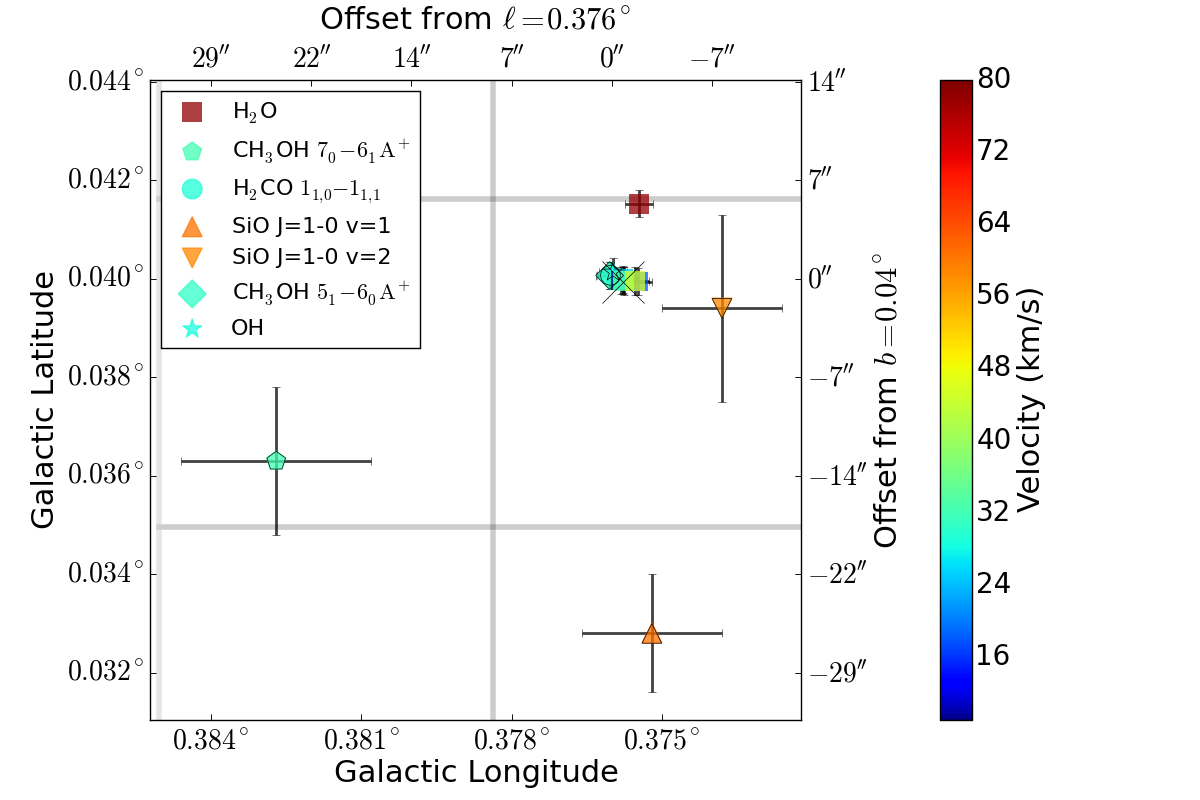
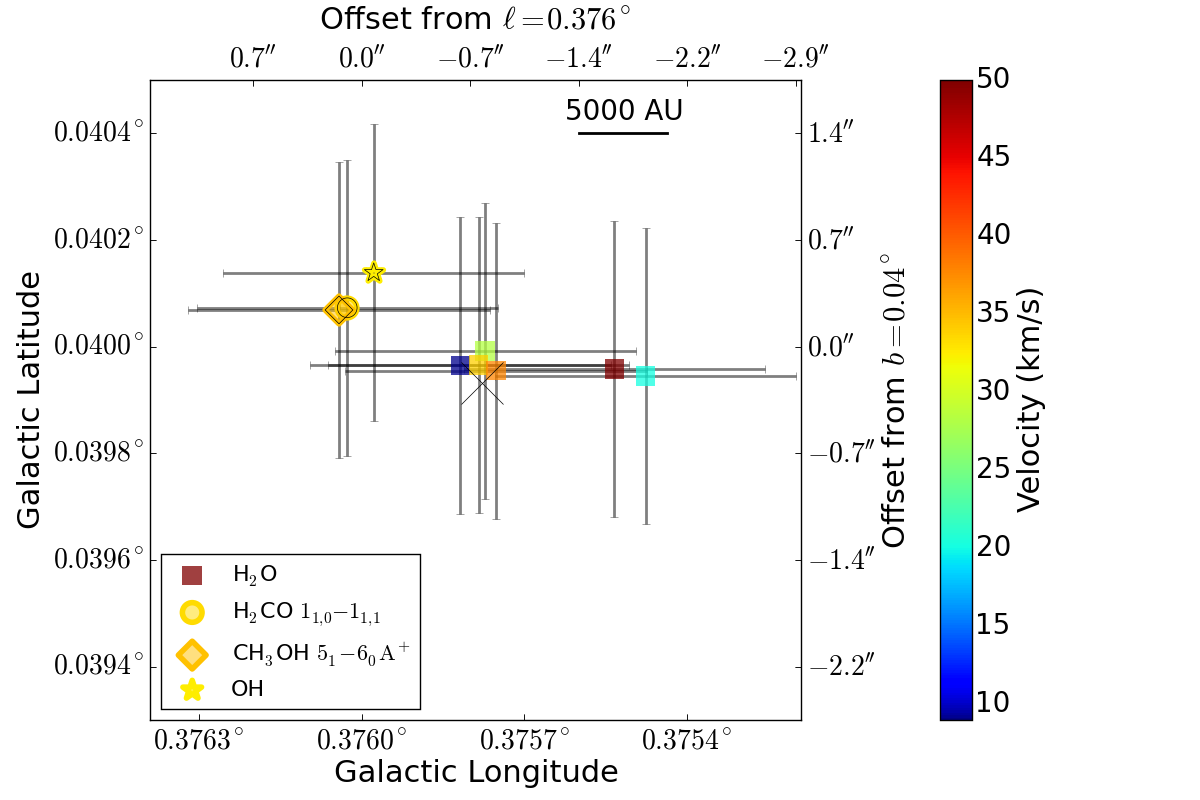
Fig. 1
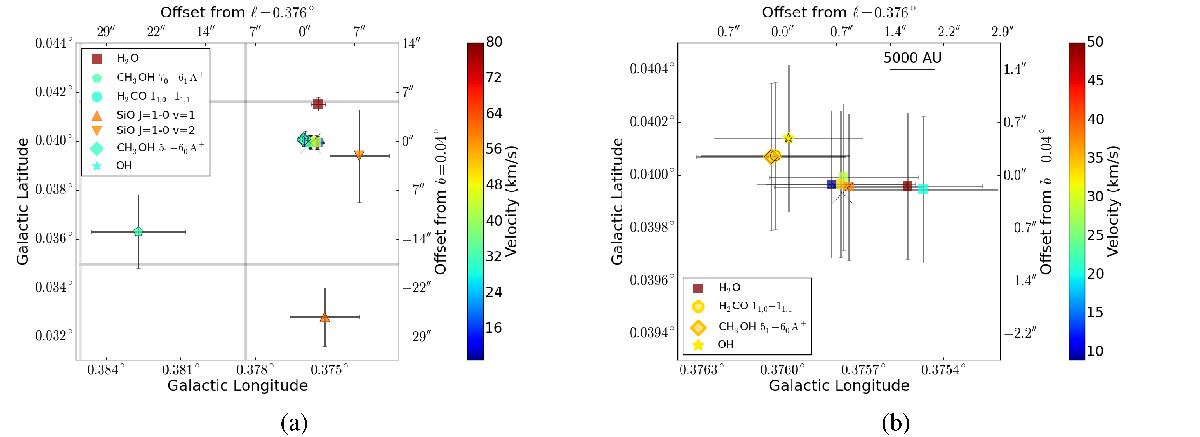
Overview of the detected masers colored by velocity. The positional errors on the SiO and CH3OH70−61+ measurements are much larger than for the other data sets because the measurements are low signal-to-noise from single-dish observations, yet they are still likely to be underestimated (see Sect. 3). The gray boxes show the pixel size from the Mopra observations of these lines. b) is a zoomed-in version of a) focusing on the interferometer observations. The large X marks the centroid location of the SMA-detected “core” (Walker et al., in prep.).
Current usage metrics show cumulative count of Article Views (full-text article views including HTML views, PDF and ePub downloads, according to the available data) and Abstracts Views on Vision4Press platform.
Data correspond to usage on the plateform after 2015. The current usage metrics is available 48-96 hours after online publication and is updated daily on week days.
Initial download of the metrics may take a while.