Fig. A.3
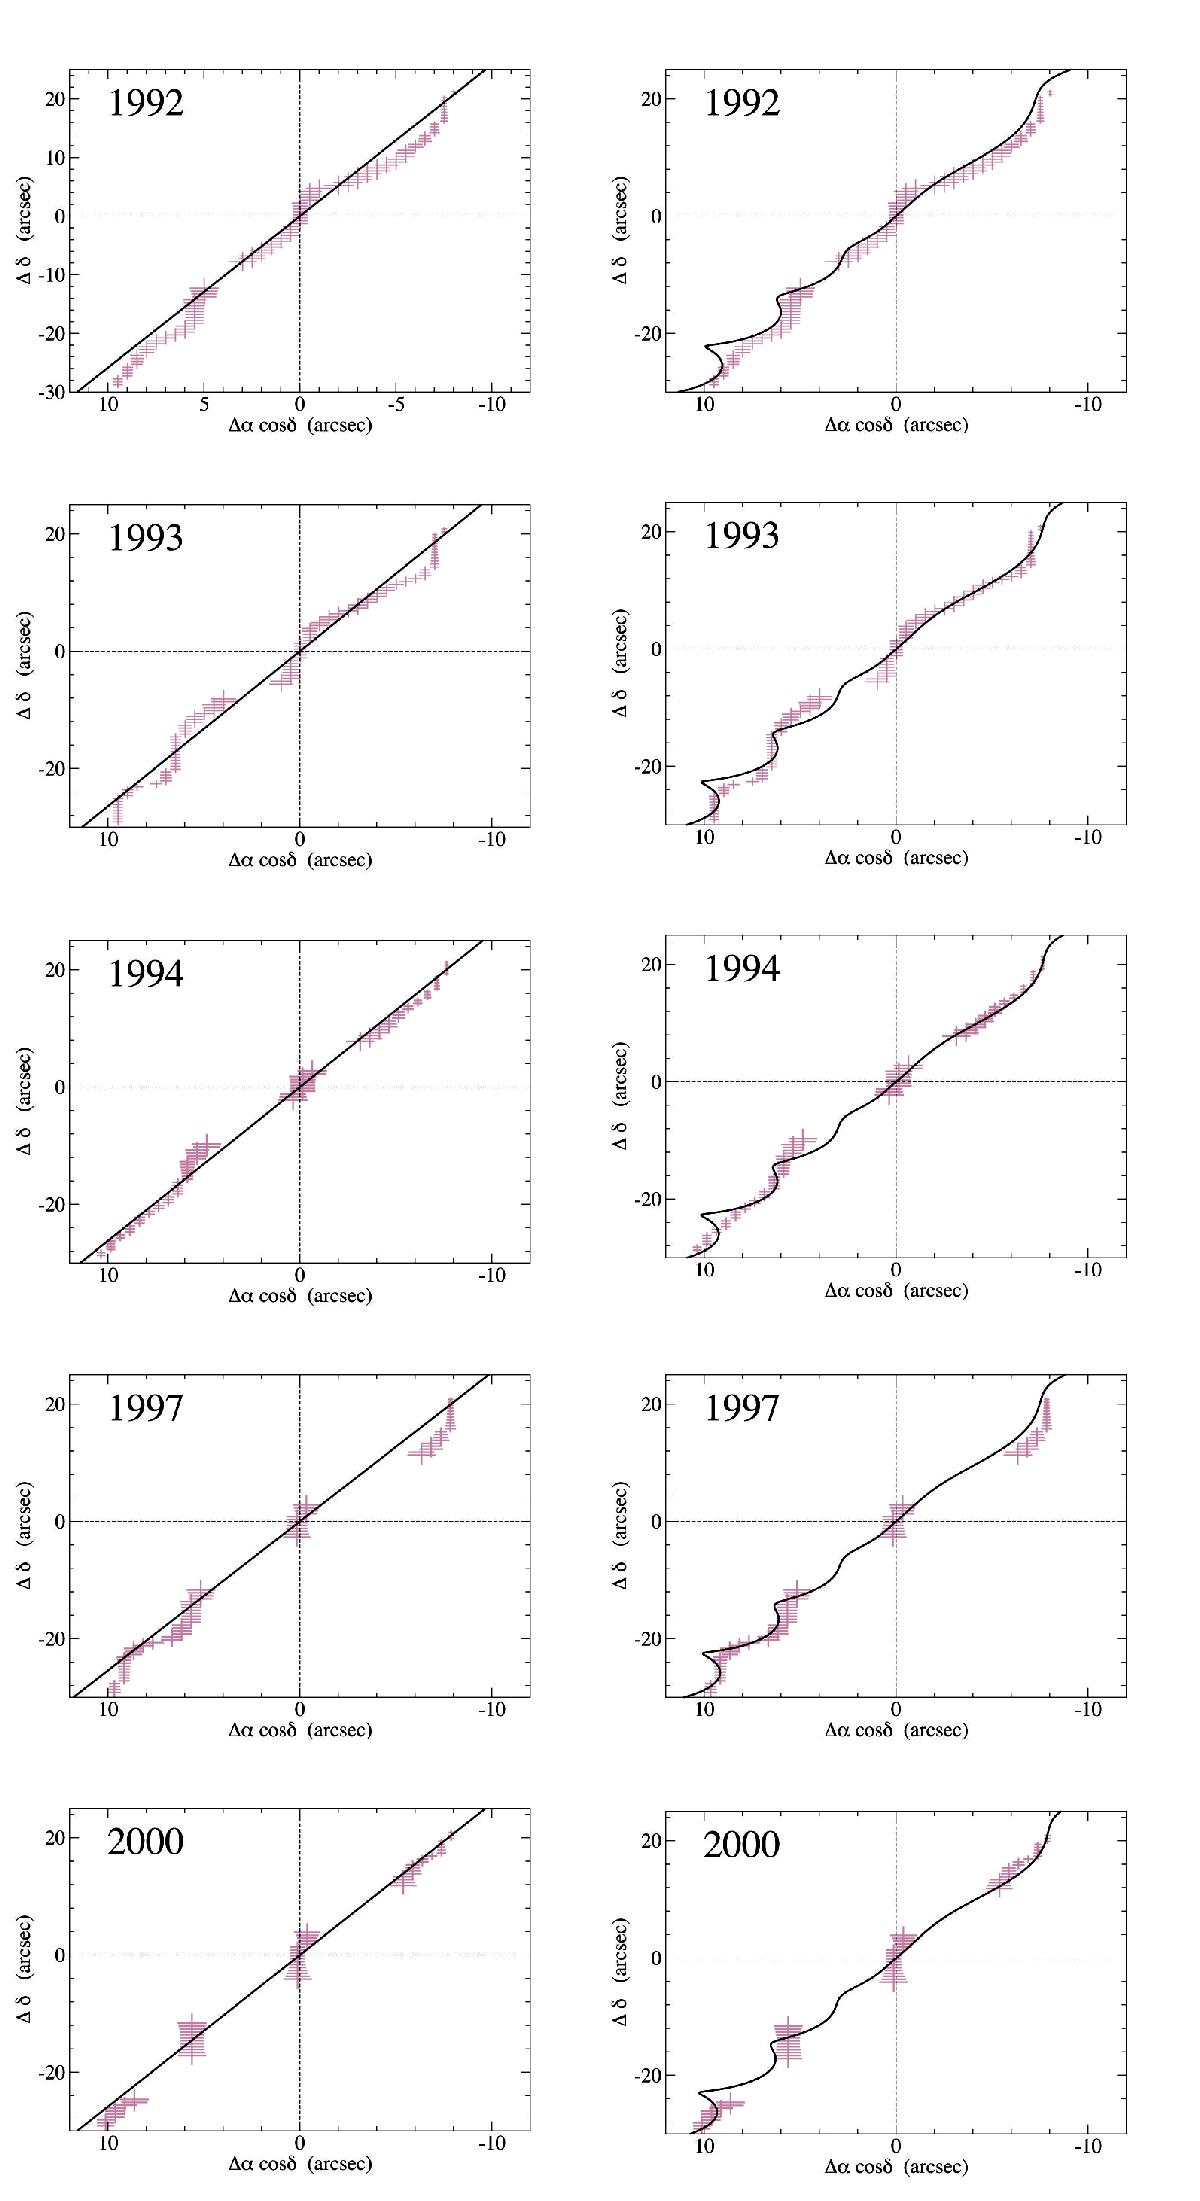
Left: attempts to fit the 1992 to 2000 observing epochs of the 1E 1740.7−2942 radio jets using rectilinear trajectories (thick lines). All of these emanate from the central core located at the intersection of the dashed lines. The brown crosses denote the observed jet path based on the maxima skeleton discussed in the text. The horizontal scale has been expanded to better show the straight line displacements from the jet flow. The reduced ![]() value of the combined five epoch fit amounts to 2.2. Right: fits to the 1992 to 2000 observing epochs of the 1E 1740.7−2942 radio jets based on the Hjellming & Johnston (1981) precessing twin jet model (thick lines). To facilitate an easy comparison, the outline of these plots is the same as in the left panel except for the fitting curves. We used the corresponding model parameter values given in right column of Table 2. The fit agreement with the observed jet paths appears to be significantly better here, with a reduced
value of the combined five epoch fit amounts to 2.2. Right: fits to the 1992 to 2000 observing epochs of the 1E 1740.7−2942 radio jets based on the Hjellming & Johnston (1981) precessing twin jet model (thick lines). To facilitate an easy comparison, the outline of these plots is the same as in the left panel except for the fitting curves. We used the corresponding model parameter values given in right column of Table 2. The fit agreement with the observed jet paths appears to be significantly better here, with a reduced ![]() value as low as 0.91.
value as low as 0.91.
Current usage metrics show cumulative count of Article Views (full-text article views including HTML views, PDF and ePub downloads, according to the available data) and Abstracts Views on Vision4Press platform.
Data correspond to usage on the plateform after 2015. The current usage metrics is available 48-96 hours after online publication and is updated daily on week days.
Initial download of the metrics may take a while.